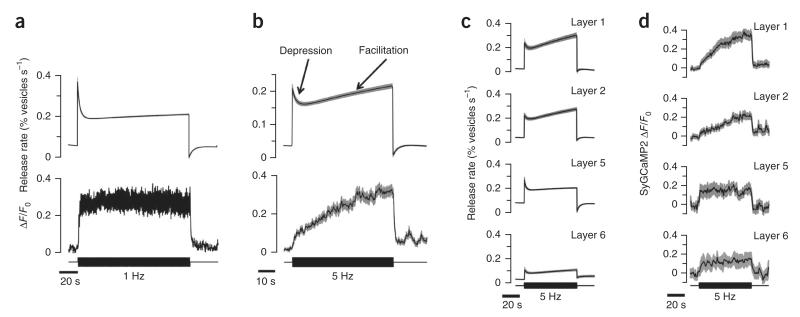
Figure 4. Presynaptic calcium signals associated with depression and facilitation.
(a) Average relative release rate (upper trace, n = 309 terminals, 4 fish) and SyGCaMP2 signal (middle, n = 295 terminals, 5 fish) in two separate series of measurements in OFF terminals responsive to contrast. The stimulus frequency of 1 Hz was chosen to cause a dominance of depression. Note that the SyGCaMP2 signal is steady on the timescale over which synapses depress. (b) Stimulation at 5 Hz, chosen to cause an approximately 1:1 ratio between depressing and facilitating synapses (Fig. 1). Average relative release rate (n = 659 terminals, 7 fish) and SyGCaMP2 signal (n = 170 terminals, 5 fish) in OFF terminals responsive to contrast. Note the gradual increase in presynaptic calcium on the timescale that vesicle release facilitates. (c) The average relative release rates of OFF terminals in layers 1, 2, 5 and 6 responding to a 5-Hz stimulus. Terminals insensitive to contrast (group 3) were not included. Facilitating OFF terminals were found predominantly in layers 1 and 2. (d) The average SyGCaMP2 signal in OFF terminals in layers 1, 2, 5 and 6 responding to a 5-Hz stimulus. Note that, in layer 5 and 6, the presynaptic calcium levels were steady and depression was the predominant response, whereas there was a gradual rise in presynaptic calcium and a larger proportion of terminals generating a facilitating response in layers 1 and 2. Gray shaded areas indicate s.e.m.

