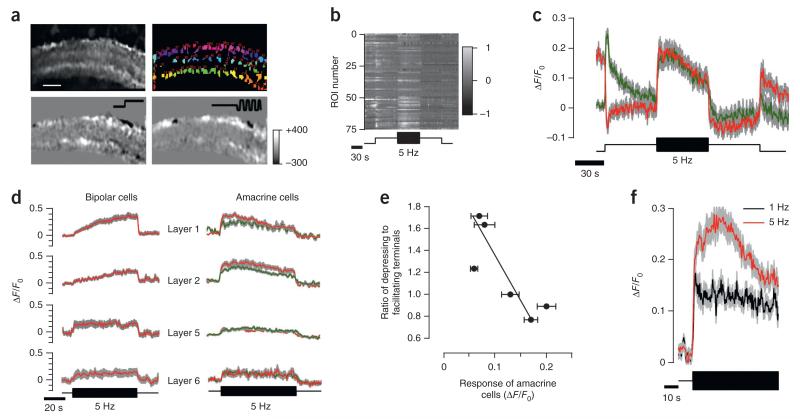
Figure 5. Stratification of amacrine cells synapses responding to contrast.
(a) Top, field of view showing SyGCaMP3 in synapses of amacrine cells and ROIs over puncate marked with different colors. Scale bar represents 15 μm. Bottom, difference images highlighting the change in SyGCaMP3 fluorescence in response to a step of light (left) and contrast (right). Color scale on the right indicates changes in fluorescence (arbitrary units). (b) Raster plot showing the relative change in fluorescence for each ROI shown in the bottom left image in a. (c) Average responses of ON (green) and OFF (red) amacrine cell synapses to a step of light and contrast (n = 158 and 175 terminals from 5 fish). (d) Right, average SyGCaMP3 response in ON (green) and OFF (red) amacrine cells in layers 1, 2, 5 and 6. Left, calcium dynamics in the same layers (from Fig. 4d). (e) Ratio of depressing to facilitating bipolar cell terminals (measured with sypHy) as a function of the amplitude of the initial response to contrast in amacrine cells. Each point represents averaged responses in one layer of the IPL calculated from 1,447 terminals from five fish. Data are fitted with a line (slope = −5.5 ± 1.95). (f) Amacrine cells adapted less and had smaller initial responses at lower temporal frequency (1 Hz, black, n = 64 terminals from 2 fish) than at high frequency (5 Hz, red, n = 230 terminals from 5 fish). Data represent responses from layer 2. Areas shaded gray indicate s.e.m.

