Figure 3.
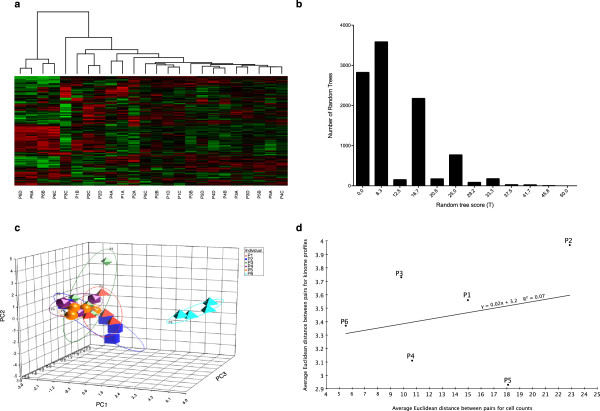
Clustering of porcine kinome profiles. (a) Hierarchical clustering of porcine kinome profiles. For details, see the caption for Figure 1a. (b) Distribution of random tree scores. For comparison, the score of the actual tree shown in part A is 50. (c) Three dimensional PCA. Individual subjects (P1, P2, P3, P4, P5, and P6) are color-coded. (d) Correlation between PBMC composition and kinome profiles. The procedure for generating this figure is the same as for Figure 2d.

