
Figure 1.
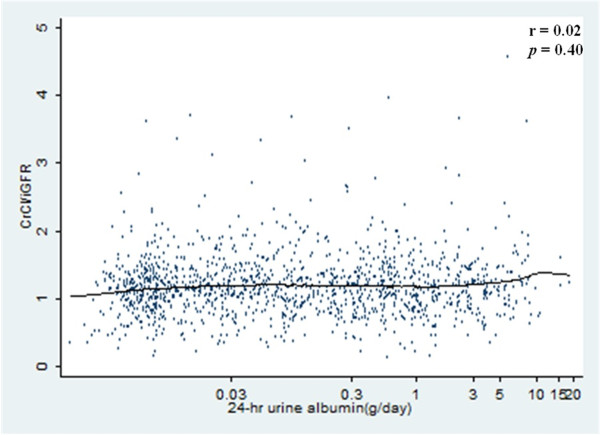
Scatter plot with a locally weighted scatterplot smoothing line showing that 24-hrs urinary albumin is not correlated with CrCl/iGFR (rs = 0.02, P = 0.40 by Spearman’s correlation test) (two outlier with CrCl/iGFR ratio of 6.71, 0.04 were omitted).