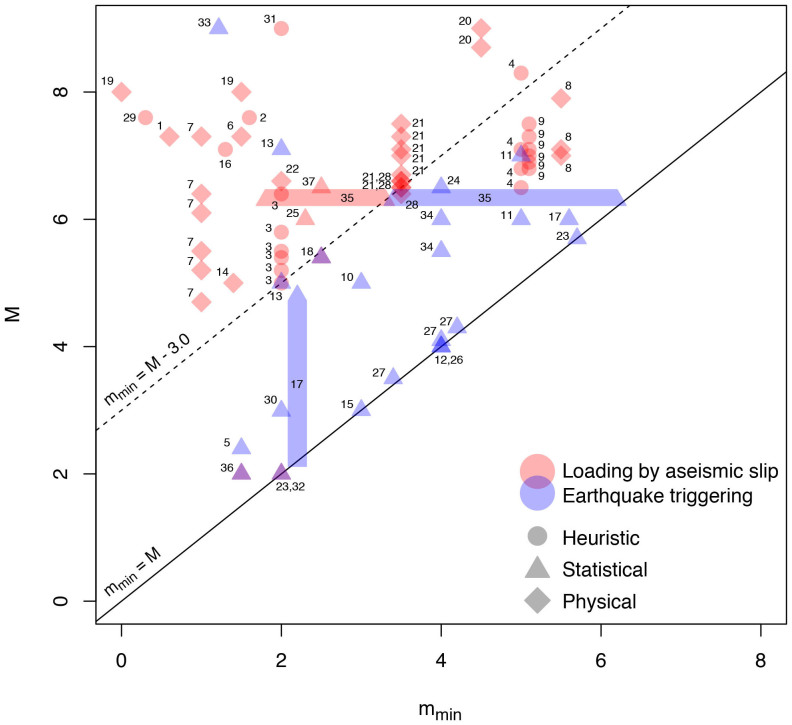
Figure 2. Meta-analysis of 37 published studies in which the origin of observed foreshocks is determined.
Mainshock magnitude M versus minimum foreshock magnitude mmin. Arguments are based on heuristic, statistical or physical considerations. Numbers (from 1 to 37 - not to be confounded with reference numbers in the main text) correspond to the different studies considered in chronological order from 1982 to 2013. Matching between number and reference is given in Supplementary Table S1. A same study may include different values of M and mmin, yielding a total of 77 data points. The emergence of an anomalous foreshock behaviour (i.e. loading process due to aseismic slip) is observed once microseismicity is included in the analysis, roughly with mmin < M − 3.0; otherwise foreshocks are best explained by the normal behaviour of seismicity (i.e. earthquake triggering process).

