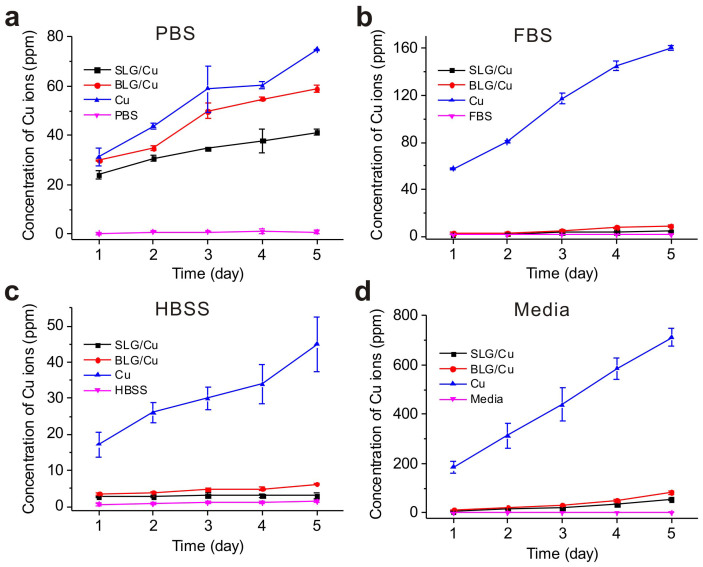
Figure 1. Concentration of Cu2+ ions from different biological solutions.
Concentrations of Cu2+ ions in (a) PBS, (b) FBS, (c) HBSS solutions and (d) cell culture media with presence of SLG/Cu (black), BLG/Cu (red) and Cu (Blue) and blank solutions as controls (Pink) measured by ICP-MS, respectively. All results are presented in a mass ratio (ppm).

