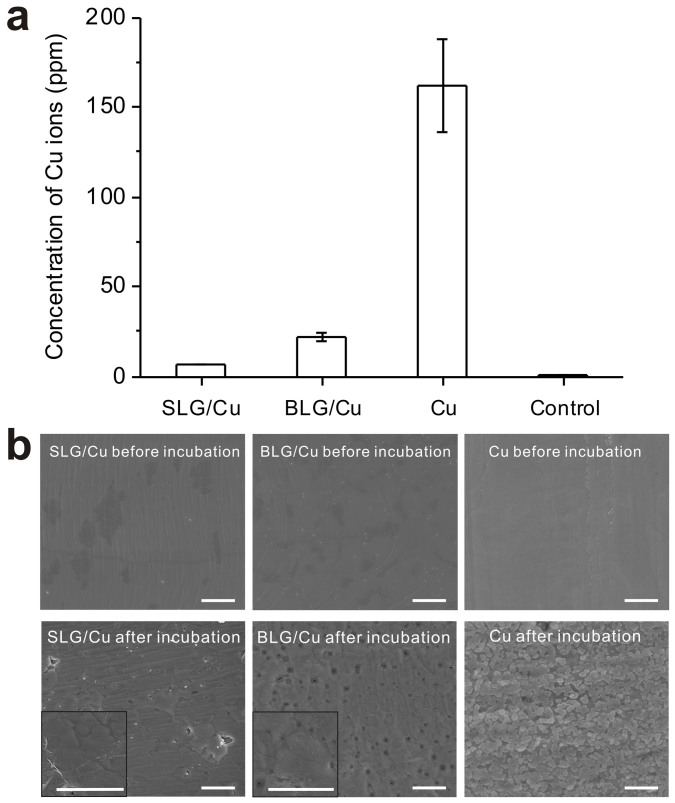
Figure 3. Concentration of Cu ions and SEM images of Cu foils after incubation for 1 day.
(a) Concentrations of Cu2+ ions of control medium, and of medium after incubated with SLG/Cu, BLG/Cu and Cu for 1 day. (b) SEM images of SLG/Cu, BLG/Cu and Cu before and after incubation. Insets are high magnification SEM images for SLG/Cu and BLG/Cu after incubation, respectively. Scale bar: 1 μm.

