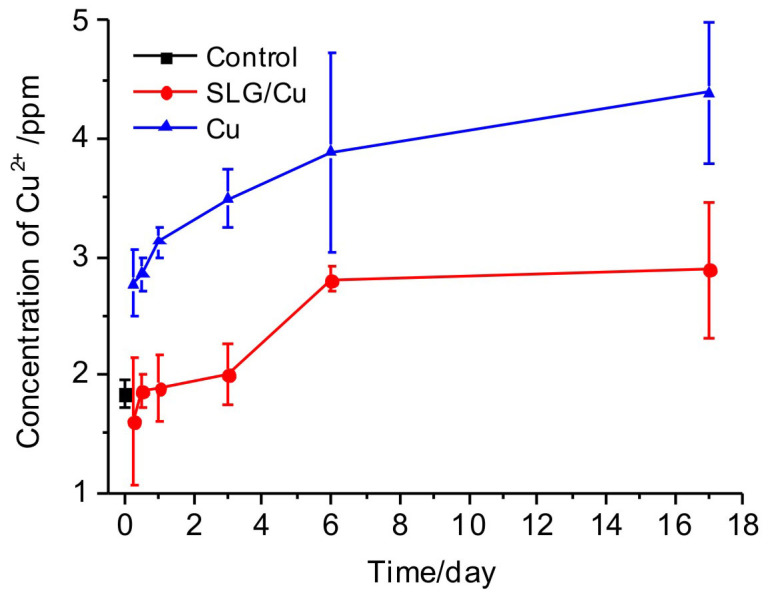
Figure 8. Concentrations of Cu2+ ions in blood extracted from live rats.

Concentrations of Cu2+ ions from normal rats before implantation as control (black square), rats with implanted SLG/Cu foils (blue triangles) and rats with implanted Cu foils (red dots) as a function of time after implantation.
