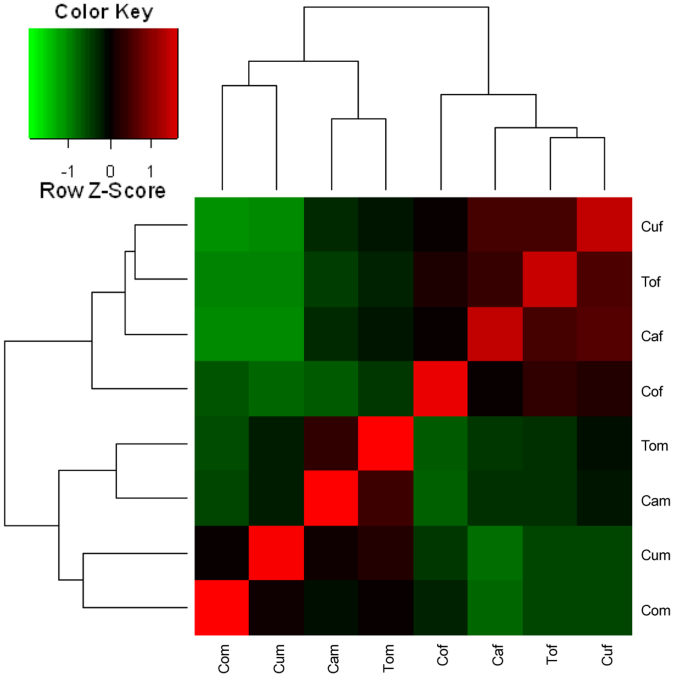
Figure 1. Pairwise correlation between all of the samples based on the Spearman correlation coefficient.
Based on the read counts measurements, the heatmap exhibits a hierarchical clustering of 8 transcriptome samples (sex*host plant). The inserted color key depicts the value of Spearman correlation coefficient, ranging from green (normalized expression of −1) to red (normalized expression value of 1).

