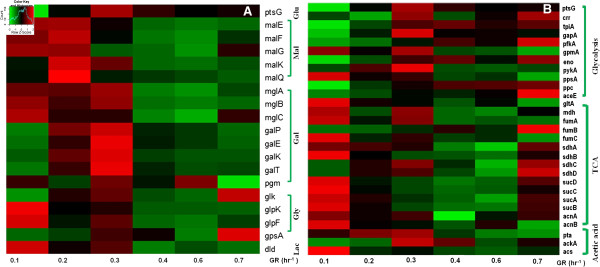
Figure 4.

Gene expression profiles in E. coli cells at various growth rates. Relative gene expression levels of (A) the substrate transport and catabolism related genes, (B) of genes of the glycolysis pathway, TCA cycle and acetic acid pathway enzymes. Relative gene expression values from the highest (red) to the lowest (green) levels are shown.
