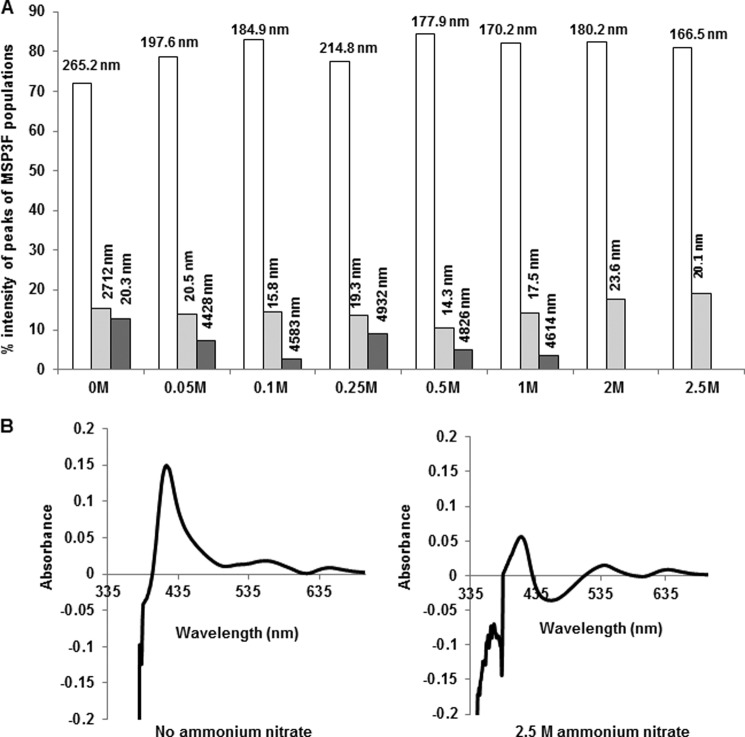
FIGURE 5.
Effect of ammonium nitrate on aggregation and heme complex formation of MSP3. A, graph depicting ammonium nitrate concentration versus percentage of intensity peak detected by DLS. The readings above each column show the calculated diameter (in nanometers) of each population detected in DLS spectra for MSP3F. With increasing ammonium nitrate concentration, the percentage of larger aggregates is decreased and finally disappears at 2.5 m ammonium nitrate concentration. B, comparison of UV spectrophotometry analysis of MSP3 heme binding (50 μg) in the absence and addition of ammonium nitrate. Heme interaction is significantly reduced in the presence of ammonium nitrate.

