FIGURE 2.
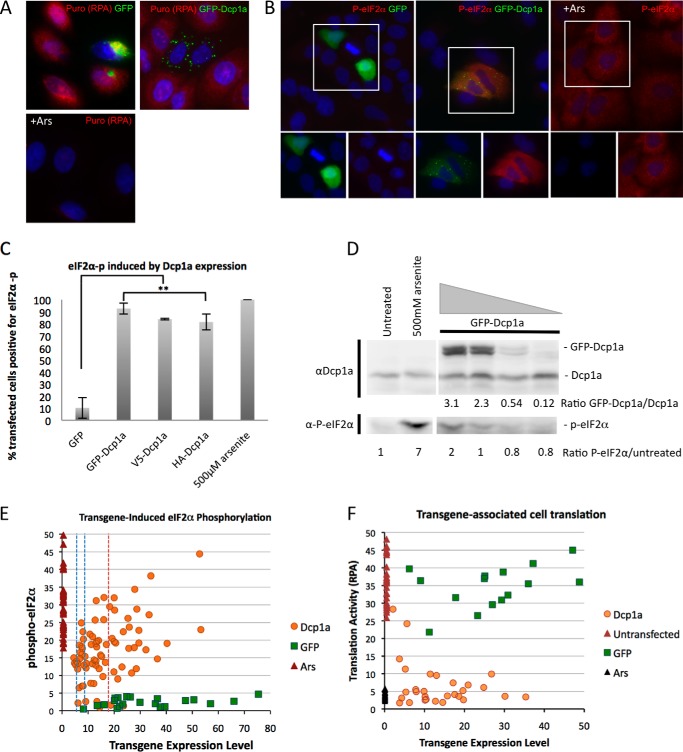
GFP-Dcp1 expression induces eIF2α phosphorylation. A, A549 cells were transfected with 1 μg/1.5 × 105 cells of pcDNA4-GFP (top left panel) and peGFP-Dcp1a (top right panel) or treated with 500 μm sodium arsenite (Ars) (bottom panel) and processed according to the RPA procedure described under “Experimental Procedures.” B, A549 cells were transfected with 1 μg/1.5 × 105 cells OF GFP (left panel) and GFP-Dcp1a (center panel) plasmid DNA or treated with 500 μm sodium arsenite (right panel) and incubated with an antibody against phospho-eIF2α (Ser-51). Corresponding eIF2α phosphorylation is shown in red. The highlighted area of the larger merged color image is separated into its constituent colors in the bottom panels. C, quantification of eIF2α phosphorylation in response to GFP or GFP-Dcp1a expression as described under “Experimental Procedures.” Error bars indicate the mean ± S.D. D, immunoblot analysis of A549 cells transfected with increasing amounts of peGFP-Dcp1a (2 μg, 1 μg, 500 ng, or 250 ng/5 × 105 cells) or treated with 500 μm sodium arsenite measuring the levels of GFP-Dcp1a compared with endogenous Dcp1a with the corresponding induction of P-eIF2α. The ratio of GFP-Dcp1a to endogenous Dcp1a is indicated beneath the immunoblot analysis, as are the ratios of P-eIF2α to untreated cells. E, scattergram showing the levels of eIF2α phosphorylation and Dcp1a expression in individual A549 cells transfected with 2 μg DNA/5 × 105 cells. The range of fluorescence signals was obtained from cell-by-cell analysis with Image J software and plotted as mean cytoplasmic pixel intensity. The controls indicate the cytoplasmic pixel intensities observed in cells with GFP expression and 500 μm sodium arsenite treatment. The red dashed line indicates the mean Dcp1a expression level corresponding to D, calculated to a population 6-fold excess of GFP-Dcp1a over endogenous Dcp1. Blue dashed lines indicate calculated mean expression levels for populations with 2- or 3-fold Dcp1a-GFP expression excess over endogenous Dcp1a. F, scattergram showing the level of translation activity (RPA fluorescence intensity) versus Dcp1a expression level in individual cells and within control cells (untreated, treated with arsenite, or expressing GFP) analyzed as in E.

