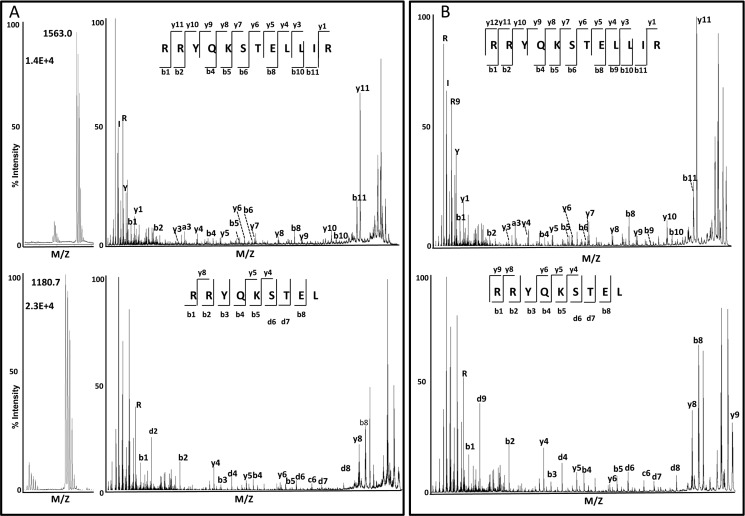
FIGURE 4.
Identification of RRYQKSTELLIR and RRYQKSTEL from C1R-B*27:05 cells. A, MALDI-TOF MS spectra (left panel) from the HPLC fractions 150 and 121, respectively, corresponding to the maximum of the elution profile of each peptide during the fractionation of the B*27:05-bound peptide pool. Only the relevant ion peaks are shown. The sequence of both ligands was determined by MALDI-TOF/TOF MS/MS (right panel); B, MALDI-TOF/TOF MS/MS spectra of the corresponding synthetic peptides.

