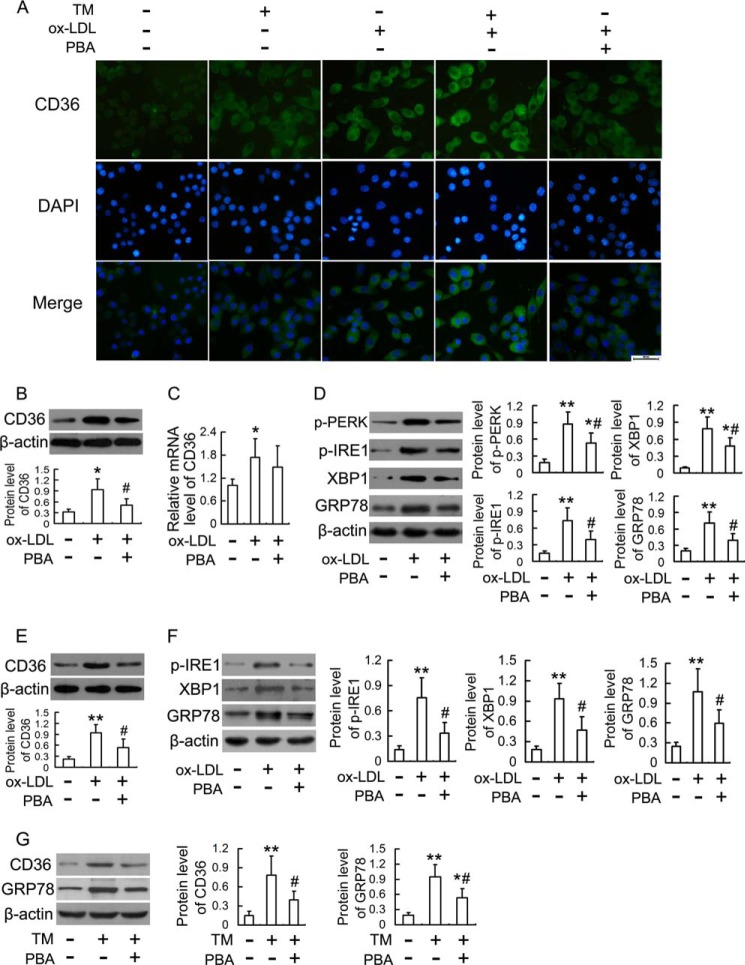
FIGURE 3.
Effects of TM and PBA on ox-LDL-induced CD36 expression in macrophages. A, immunofluorescence experiments show CD36 visualized by FITC labeling (green) and nuclei stained with DAPI (blue). RAW264.7 cells were treated with 50 mg/liter ox-LDL in the presence or absence of TM (0.5 mg/liter) and PBA (20 mm) for 12 h. Representative fluorescent images are shown. Scale bar, 20 μm. B and C, RAW264.7 cells were stimulated with 50 mg/liter ox-LDL in the presence or absence of PBA (20 mm) for 12 h, and the expression of CD36 protein and mRNA were analyzed by Western blot and real-time PCR, respectively. D, Western blot analysis of ER stress markers in RAW264.7 cells stimulated with 50 mg/liter ox-LDL in the presence or absence of PBA (20 mm) for 12 h. E and F, Western blot analysis of CD36 and ER stress markers in human THP-1-derived macrophages treated as described in D. G, Western blot analysis of CD36 and GRP78 in THP-1-derived macrophages incubated with TM (2 mg/liter) in the presence or absence of PBA (20 mm) for 4 h. Data are presented as the mean ± S.E. of at least three independent experiments. *, p < 0.05, **, p < 0.01 versus vehicle-treated control, #, p < 0.05 versus ox-LDL-treated group.

