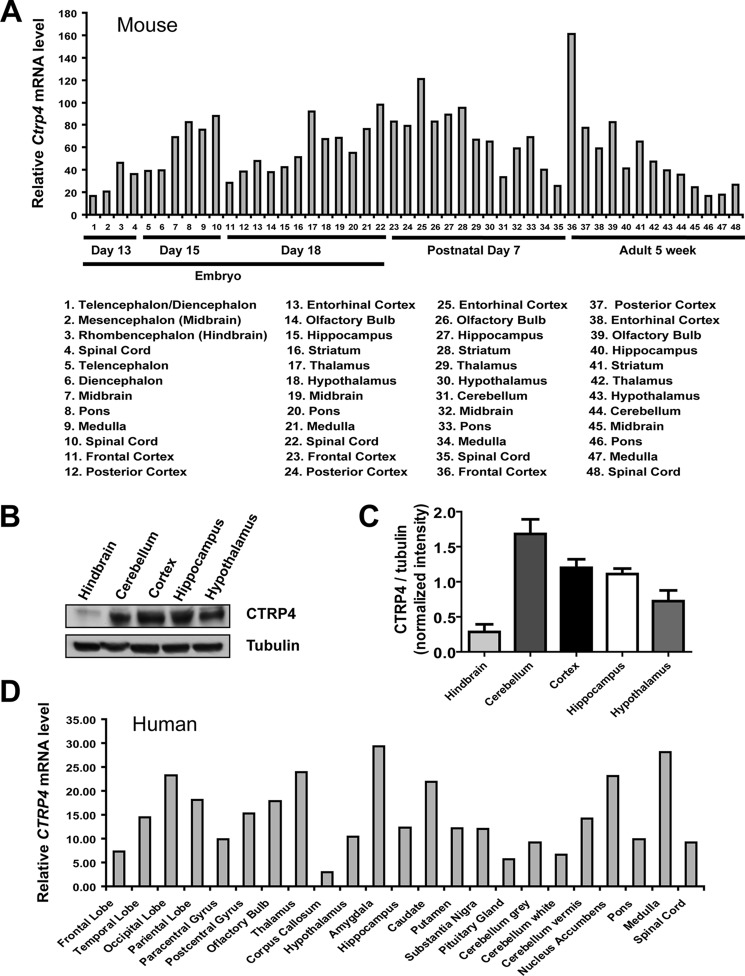
FIGURE 3.
Expression of the CTRP4 transcript in mouse and human brain. A, quantitative real-time PCR analysis of CTRP4 mRNA in different mouse brain regions for three developmental stages. B, Western blot analysis of CTRP4 in different mouse brain regions. C, quantification of Western blot analyses (n = 3 mice/group) as shown in B. The protein level was normalized to the corresponding tubulin expression level. D, expression of CTRP4 mRNA in different brain regions in the adult human. The expression level of CTRP4 transcript in each brain region was normalized to its corresponding human β-actin expression level.

