FIGURE 6.
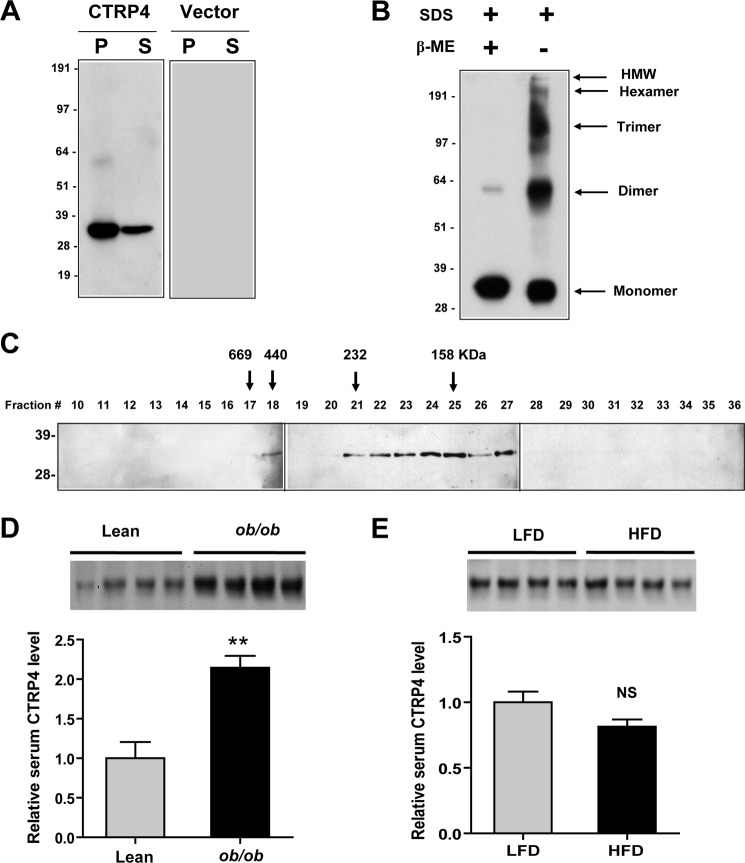
Secreted CTRP4 forms higher-order oligomeric complexes. A, HEK 293T cells were transfected with mammalian expression vectors (pCDNA3.1) alone or vectors encoding a C-terminal FLAG-tagged mouse CTRP4. Cell pellets (P) and serum-free supernatant (S) from transfected cells were subjected to immunoblot analysis using an anti-FLAG antibody. B, conditioned medium containing CTRP4 was subjected to immunoblot analysis in the presence or absence of the reducing agent β-mercaptoethanol (β-ME). HMW, high molecular weight. C, supernatant containing CTRP4 was loaded onto a Superdex 200 FPLC column, and 0.5-ml fractions were collected. Fractions 10–36 were analyzed by SDS-PAGE immunoblot analysis using an anti-FLAG antibody. The arrows correspond to the peak elution fractions of molecular standard thyroglobulin, ferritin, catalase, and aldolase with molecular weights of 669, 440, 232, and 158 kDa, respectively. The numbers on the left of each immunoblot analysis indicate the molecular weight marker. D, Western blot quantification of serum CTRP4 in leptin-deficient ob/ob mice (n = 7) and lean controls (n = 7). Each lane represents serum from a different mouse. Only four serum samples from each group are shown. E, Western blot quantification of serum CTRP4 levels in mice fed a low-fat diet (LFD, n = 7) and high-fat diet (n = 7). Each lane represents serum from a different mouse. Only four serum samples from each group are shown. **, p < 0.01. NS, not significant.

