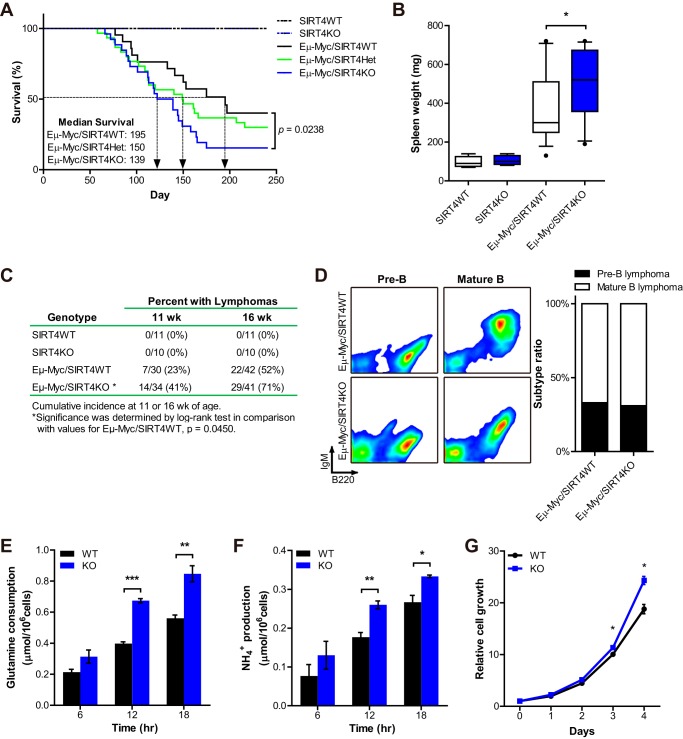
FIGURE 4.
SIRT4 loss accelerates Myc-driven B cell lymphoma. A, analysis of overall survival of Eμ-Myc/SIRT4WT (n = 24), Eμ-Myc/SIRT4Het (n = 30), and Eμ-Myc/SIRT4KO (n = 26) mice. p = 0.0238 by the log rank test. B, spleen weight of WT (n = 5), KO (n = 5), Eμ-Myc/SIRT4WT (n = 15), and Eμ-Myc/SIRT4KO (n = 14) mice at autopsy. The boxes represent the interquartile range; whiskers represent the 10th–90th percentile range; and bars represent the median. C, cumulative lymphoma incidences at 11 and 16 weeks of age. Significance between Eμ-Myc/SIRT4WT and Eμ-Myc/SIRT4KO mice was determined by log rank test. p = 0.0450. D, left, analysis of lymph node cell suspensions isolated from Eμ-Myc/SIRT4WT and Eμ-Myc/SIRT4KO mice. Dot plots show B220 and IgM expression on the cell population from independent mice that were examined after the onset of illness by using flow cytometry. Right, relative frequencies of lymphoma types of Eμ-Myc/SIRT4WT (n = 12) and Eμ-Myc/SIRT4KO (n = 13) mice: pre-B lymphoma (B220+IgM−) and mature B lymphoma (B220+IgM+). E and F, glutamine uptake (E) and ammonia production (F) from B cell lymphoma cells from Eμ-Myc/SIRT4WT and Eμ-Myc/SIRT4KO mice incubated for the indicated times (n = 3). Data are mean ± S.E. G, growth curves of B cell lymphoma cells from Eμ-Myc/SIRT4WT and Eμ-Myc/SIRT4KO mice. Cell number was measured every 24 h for 4 consecutive days (n = 3). Data are mean ± S.D. *, p < 0.05, **, p < 0.01, and ***, p < 0.001.

