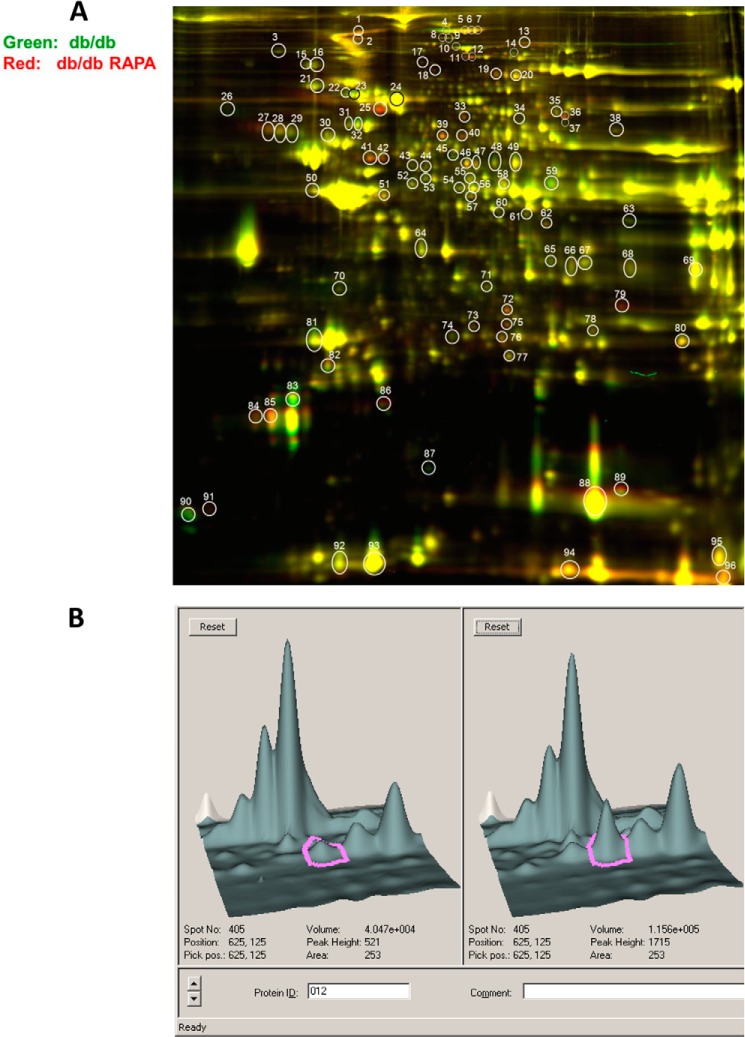
FIGURE 5.
Scanned images of the two-dimensional gels. A, overlay image for gel comparison between heart from db/db (labeled in green dye) and heart from db/db mouse treated with RAPA for 28 days (labeled in red dye). The circled and numbered protein spots (30 spots in total 96 spots with a cutoff ratio of 1.5 for alteration in protein expression among the three treatment options) are subsequently isolated from the gels and identified by MALDI-TOF/TOF mass spectroscopy. B, representative three-dimensional DeCyder software integrated graph showing difference in PYGB (spot 12) between db/db and db/db + RAPA-treated mice.

