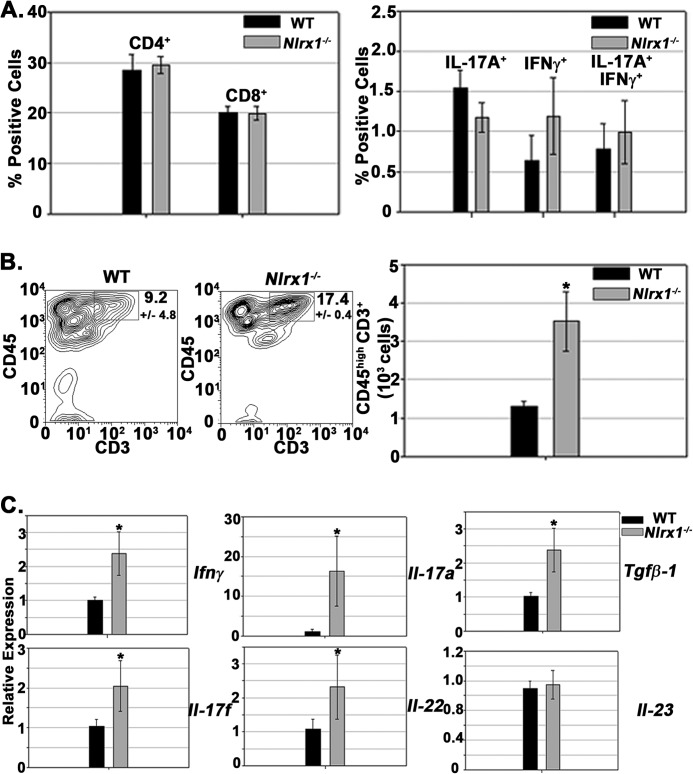
FIGURE 3.
Encephalitogenic T cell accumulation in the CNS is heightened in Nlrx1−/− mice. A, left panel, frequency of CD4+ and CD8+ T cell in the draining lymph nodes during EAE at 12 dpi. Cells were gated on CD3+ CD4+ or CD3+ CD8+. n = 6 mice/group. Right panel, intracellular cytokine staining in CD3+ CD4+ T cells 48 h after stimulation with MOG(35–55) peptide. B, analysis of T cell infiltration during active EAE. Left panel, contour map depicting the selection of the CD45high CD3+ population in spinal cord tissue. Right panel, quantification of the CD45high CD3+ cell populations in WT and Nlrx1−/− mice. n = 6 mice/group. C, real-time PCR analysis of various inflammatory genes in spinal cord tissue at 14 dpi. n = 6 (WT) and 7 (Nlrx1−/−). Relative expression levels were normalized to the WT (WT = 1). Error bars represent mean ± S.E. *, p < 0.05.

