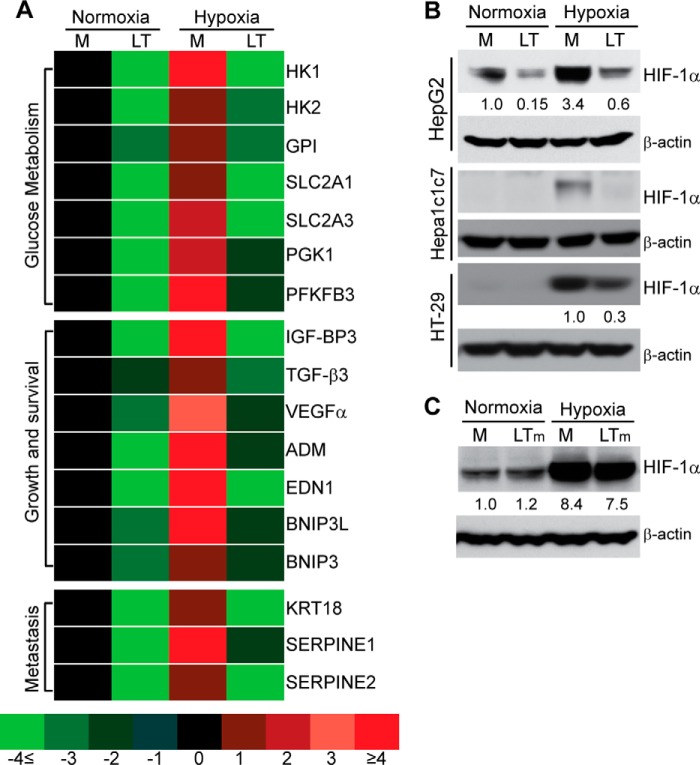
FIGURE 2.
Anthrax LT treatment blocks the induction of HIF-1α and its target genes. A, differential expression of HIF-1α target genes in HepG2 cells pretreated for 3 h with (LT) or without (M) LT, and then cultured in normoxic or hypoxic conditions for 20 h. Gene expression is indicated by a color code that ranges from light green (4 or more fold lower than reference levels in normoxic cells cultured in medium alone) to bright red (4 or more fold greater than the reference levels). B, Western blotting analysis of HIF-1α expression in various cell lines treated with (LT) or without (M) LT in normoxic or hypoxic conditions as indicated. Shown is one representative of three independent experiments showing the same trend. C, HepG2 cells were cultured for 3 h in medium alone (M) or with medium containing a combination of wild-type PA and mutated lethal factor lacking protein cleavage activity (LTm), and they were then cultured in normoxic or hypoxic conditions for an additional 4 h. Shown are Western blotting results from one of two independent experiments exhibiting the same trend. The intensity of protein bands in B and C was quantified using Fluorchem Q software; relative amounts are shown below each lane.

