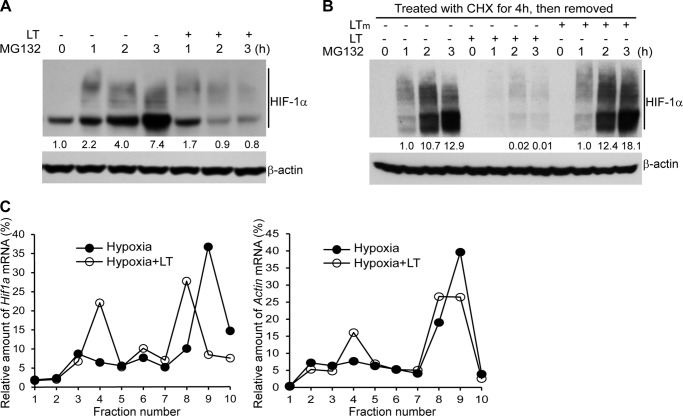
FIGURE 4.
Anthrax LT treatment inhibits HIF-1α protein synthesis. A, Western blotting analysis of HIF-1α protein levels in HepG2 cells cultured in the presence or absence of LT and/or MG132 for the indicated periods of time. B, Western blotting analysis of HIF-1α protein levels in HepG2 cells, which were treated with CHX for 4 h in the presence or absence of wild-type LT or a protease-deficient LT mutant (LTm) for the last 2 h. Cells were subsequently washed twice with PBS and then incubated with MG132 for 0–3 h in the absence of LT or LT mutant as indicated. The intensity of protein bands in A and B was quantified using Fluorchem Q software; relative amounts are shown below each lane. C, polysomal distribution of HIF-1α (left panel) and β-actin (right panel) mRNA in HepG2 cells cultured in the presence or absence of LT for 3 h and then cultured in hypoxic conditions for 4 h. The treated cells were extracted with polysome extraction buffer, and the supernatants were fractioned through a 10–50% sucrose gradient. HIF-1α and β-actin mRNA levels in each gradient fraction were determined by quantitative PCR and plotted as a percentage of the total HIF-1α and β-actin mRNA levels in each sample. The peak in fraction 4 corresponds to monosomes, whereas the peak in fractions 8–10 corresponds to polysomes with active translation.

