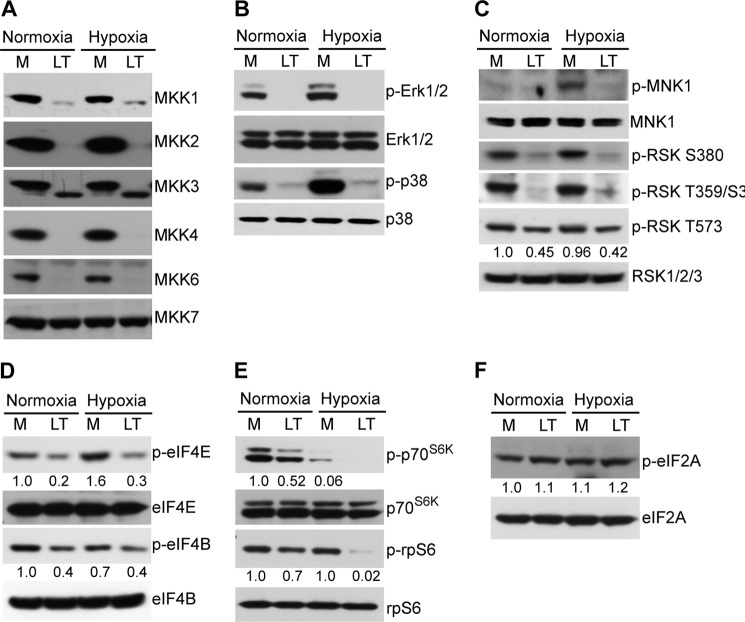
FIGURE 5.
Anthrax LT treatment disrupts signal pathways critical for protein synthesis. HepG2 cells were pretreated with (LT) or without (M) LT for 3 h and then cultured under normoxic or hypoxic conditions for an additional 4 h. Cell lysates were subjected to Western blotting analysis for assessing protein levels of various MKKs (A), total and phosphorylated ERK1/2 and p38 (B), total and phosphorylated MNK and RSK (C), total and phosphorylated eIF4E and eIF4B (D), total and phosphorylated p70S6K and rpS6 (E), and total and phosphorylated eIF2A (F). The intensity of protein bands in C–F was quantified using Fluorchem Q software; relative amounts are shown below each lane. Data shown are representative of three independent experiments.

