FIGURE 1.
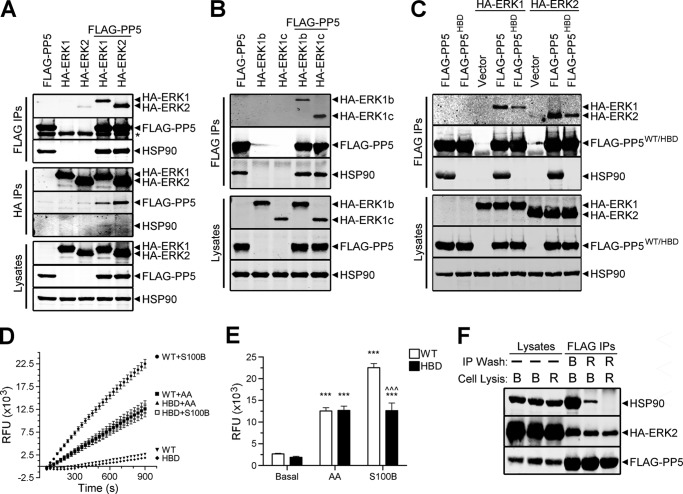
Analysis of PP5-ERK interactions and PP5 activity. A, HEK-293FT cells were transfected with FLAG-PP5, HA-ERK1, or HA-ERK2 alone or in combination, as indicated. Western analysis of FLAG immune complexes (FLAG IPs), HA immune complexes (HA IPs), and cell lysates were performed using FLAG, HA, and HSP90 antibodies. *, IgG heavy chain. B, HEK-293FT cells were transfected with FLAG-PP5, HA-ERK1b, or HA-ERK1c alone or in combination, as indicated. FLAG IPs and cell lysates were analyzed by Western as in A. C, HEK-293FT cells were transfected with wild type FLAG-PP5 or FLAG-PP5HBD alone or together with HA-ERK1 or HA-ERK2; cells were also transfected with the indicated HA-tagged kinase and pcDNA3 (Vector). FLAG IPs and cell lysates were analyzed as described in A. A significant reduction in the binding of HA-ERK1 (88.21 ± 3.01%, p < 0.0001) and HA-ERK2 (77.3 ± 8.97%, p = 0.0003) to FLAG-PP5HBD was found when ERK signals were normalized to levels of mutant PP5 in the IPs and compared with the corresponding values in the wild type FLAG-PP5 conditions, which were set to 100. The results represent the means ± S.E. analyzed by one-sample t test using two-tailed p values. D, approximately 118 ng (10 nm) of purified wild type FLAG-PP5 (WT) or HSP90 binding-deficient mutant of FLAG-PP5 (HBD) were continuously assayed over 900 s for phosphatase activity toward DiFMUP (relative fluorescent units (RFU)) in the presence of only buffer (Basal), 100 μm arachidonic acid (AA), or 200 nm S100B plus 1 mm CaCl2 (S100B). Background fluorescence (i.e. samples containing only DiFMUP + arachidonic acid or DiFMUP + S100B + CaCl2) was measured and subtracted from the corresponding fluorescent values of the phosphatase-containing samples. Levels of fluorescence in WT + arachidonic acid, HBD + arachidonic acid, and HBD + S100B preparations were virtually identical. The results represent the means ± S.E. from six independent experiments, three experiments performed with duplicates from each of two separate purifications of WT and HBD. S.E. bars are obscured by the symbols for most data points. E, quantification of phosphatase activity at the 900 s time point. Two-way analysis of variance identified a statistically significant genotype versus activator interaction (F(5,30) = 61.83, p < 0.0001). Tukey post-tests are shown as follows: ***, versus basal, p < 0.0001; ^^^, WT versus HBD, p < 0.0001. Error bars, S.E. F, HEK-293FT cells expressing FLAG-PP5 and HA-ERK2 were lysed in Buffer B (B) or RIPA buffer (R) (Lysates). FLAG immunoprecipitations (FLAG IPs) were performed from the cell lysates and washed (IP Wash) in either Buffer B or RIPA buffer, as indicated. The FLAG IPs and corresponding cell lysates were analyzed by Western using HSP90, HA, and FLAG antibodies. The data are representative of experiments performed three (A), three (B), six (C), six (D), and two (F) independent times with similar results.

