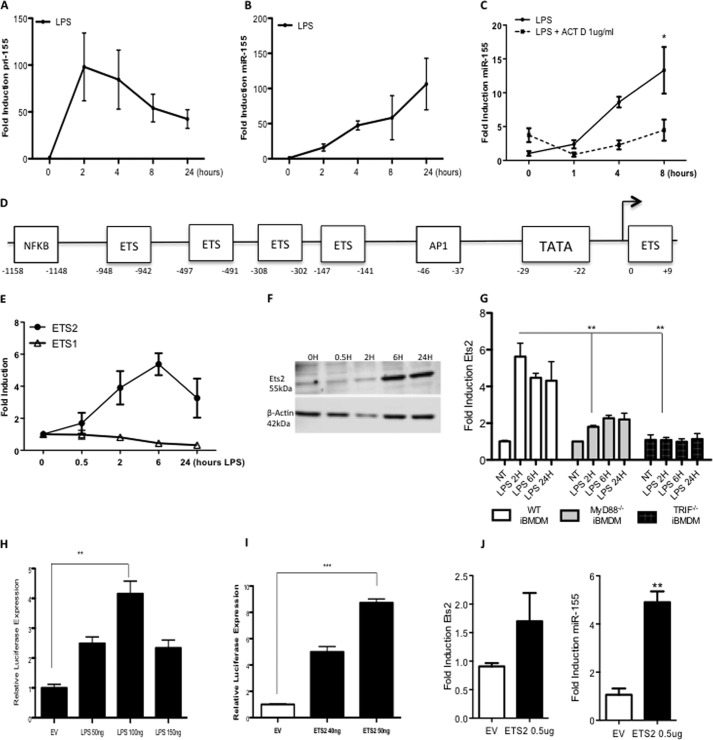
FIGURE 1.
The pri-155 promoter is controlled by Ets transcription factors. A–C, primary BMDMs from C57BL/6 mice (n = 3) were treated with LPS (100 ng/ml) for 0–24 h (A and B) or pretreated with actinomycin D (ACT D; 1 μg) prior to LPS stimulation for 24 h (C). RT-PCR analysis of RNA was carried out with primers specific for pri-155 or mature miR-155 as indicated. Expression is normalized to that of GAPDH (for pri-155 expression) or RNU6B (for miR-155 expression) and is presented relative to that of untreated controls. Data are presented as the mean ± S.E. of one representative experiment shown of three independent experiments (n = 3 per experiment). D, bioinformatic analysis of the pri-155 promoter revealed highly conserved Ets transcription factor binding sites. E and F, primary BMDM from C57BL/6 mice (n = 3) were treated with LPS (100 ng/ml) for 0–24 h. RT-PCR analysis of RNA was carried out with primers specific for Ets2 or Ets1 mRNA (E), and protein levels were measured by Western blot with antibodies specific for Ets2 or β-actin (F). Data are representative of three separate experiments, with each point assayed in triplicate, with error bars representing S.D. G, wild type, MyD88−/−, or TRIF−/− immortalized BMDMs (iBMDM) were plated at 5 × 10⁵/ml and stimulated with LPS for 0–24 h prior to lysis for RNA extraction. Ets2 or GAPDH control was measured by real-time PCR. Data are the mean ± S.D. of triplicate determinations from three independent experiments. H and I, pri-155 promoter activation was assayed in Raw264.7 cells using a pri-155 luciferase reporter construct and increasing doses of LPS (50–100 ng) (H), or plasmid encoding Ets2 (40–50 ng) or empty vector (EV) control (I). Luciferase activity was determined 24 h after transfection and normalized to TK Renilla control. Results are presented as the mean ± S.D. for triplicate determinations and are representative of three separate experiments. J, Raw264.7 cells were transfected with 0.5 μg of Ets2 plasmids or empty vector control and lysed for RNA. miR-155 expression was measured by real-time PCR. Statistical analysis was carried out using Student's t test; *, p < 0.05; **, p < 0.001; ***, p < 0.0001.

