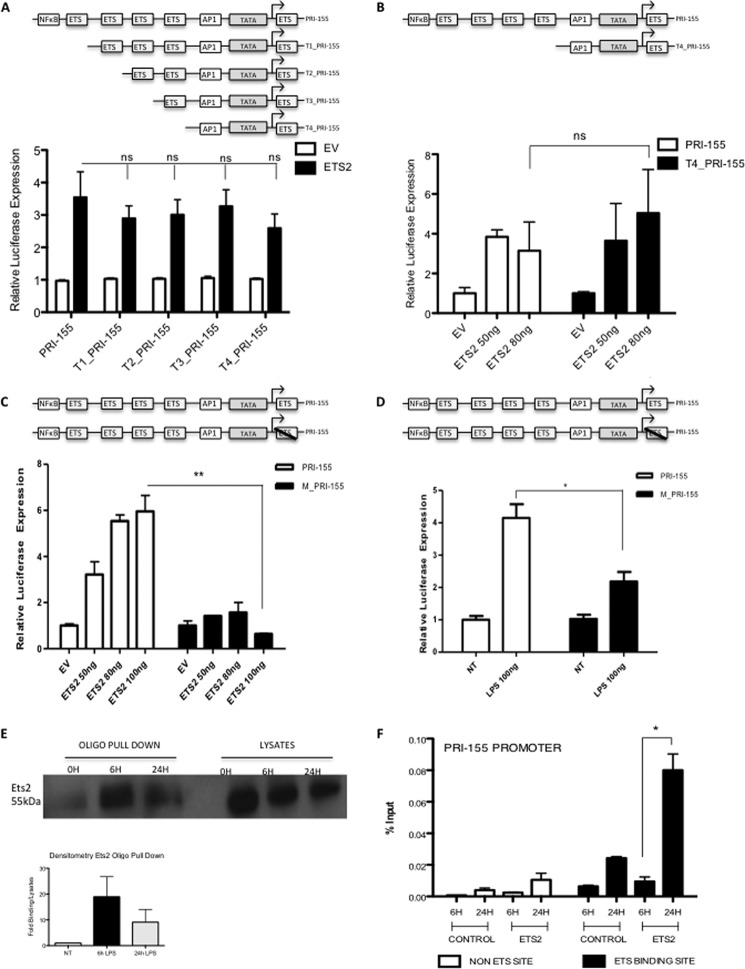
FIGURE 2.
Ets2 binds to a highly conserved binding site on the pri-155 promoter. Pri-155 promoter constructs were truncated sequentially such that one Ets binding site was deleted at a time (T1-T4_pri-155), only the terminal Ets binding site remained (T4_pri-155) or the terminal Ets binding site was mutated (M_pri-155). A, pri-155 promoter and T1-T4_pri-155 promoter activation was assayed in HEK293T cells using an Ets2 expression plasmid. B, pri-155 promoter and T4_pri-155 promoter activation was assayed in Raw264.7 cells using increasing doses of Ets2 expression plasmid (50–80 ng). C and D, pri-155 promoter and M_pri-155 promoter activation was assayed in Raw264.7 cells with increasing doses of Ets2 expression plasmid (50–100 ng) (C) or LPS (100 ng/ml) (D). Luciferase activity was determined 24–48 h after transfection and normalized to TK Renilla controls. E, Raw264.7 cells were treated with LPS for 0, 6, and 24 h and lysed, and an oligonucleotide (oligo) pulldown assay was carried out with the terminal Ets binding site oligonucleotide sequence at position 0/+9. Samples were probed for Ets2 by Western blot. Densitometry was carried out relative to lysates and are relative to non-treated control (NT). Bar graph represents the mean of two independent experiments. F, Raw264.7 cells were treated with LPS for 6 or 24 h, after which a ChIP assay was performed. Primers specific for the terminal Ets binding site on pri-155 (black bars); and additionally, a non-Ets-binding site (white bars) were designed, and binding events were measured as percent of input by real time PCR using antibodies against HA (control antibody) or Ets2. In all cases, results are presented as the mean ± S.D. for triplicate determinations and are representative of at least three separate experiments. Statistical analysis was carried out using Student's t test. *, p < 0.05; **, p < 0.001.

