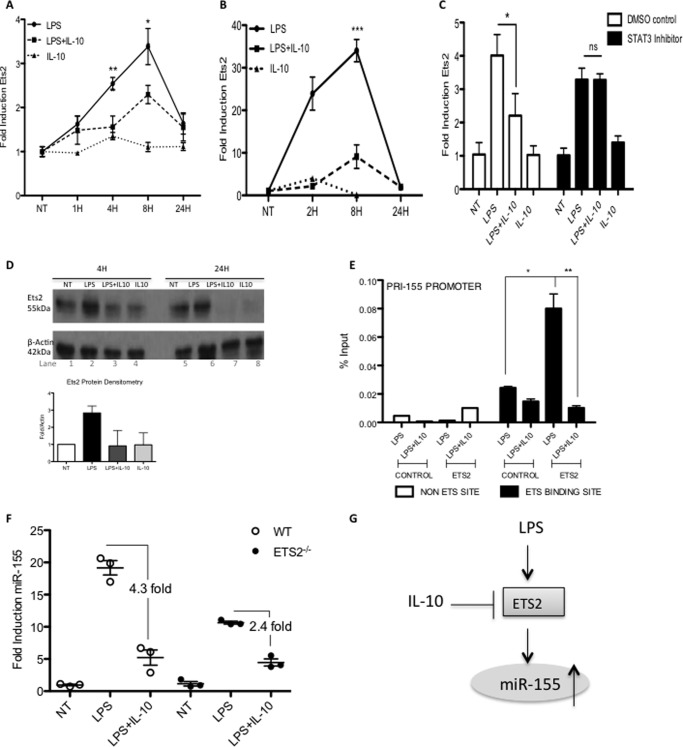
FIGURE 4.
IL-10 inhibits Ets2 induction by LPS. Raw264.7 cells (A) or primary BMDMs from C57BL/6 mice (B) were treated with LPS (100 ng/ml) and IL-10 (20 ng/ml) for 0–24 h. C, Raw264.7 cells were treated with STAT3 inhibitor (0.5–1 μm) or dimethyl sulfoxide (DMSO) control 1 h prior to stimulation with LPS (100 ng/ml) and IL-10 (20 ng/ml) for 4 h. Real time PCR results are presented as the mean ± S.E. of three independent experiments, each carried out in triplicate. D, Raw264.7 cells were treated with LPS (100 ng/ml) and IL-10 (20 ng/ml) for 0–24 h. Protein levels were measured by Western blot with antibodies specific for Ets2 or β-actin. Densitometry was carried out relative to β-actin controls and expressed as fold over non-treated samples. Densitometry is the mean of three independent experiments ± S.D. E, Raw264.7 cells were treated with LPS (100 ng/ml) ± IL-10 (20 ng/ml) for 24 h after which a ChIP assay was performed. Primers specific for the terminal Ets binding site on the pri-155 promoter at position 0/+9 (black bars) were designed, in addition to a non Ets-binding site at position −995/−1003 (white bars). Binding events were measured as percent of input by real time PCR using antibodies against HA (control antibody) or Ets2. Results are presented as the mean ± S.D. for triplicate determinations and are representative of two independent experiments. F, primary peritoneal macrophages from WT or Ets2−/− mice (n = 3) were treated with LPS (100 ng/ml) ± IL-10 (20 ng/ml) for 24 h in vitro prior to lysis for RNA extraction. miR-155 was measured by real time PCR. Data are the mean of n = 3 mice ± S.E. Statistical analysis was carried out using Student's t test. *, p < 0.05; **, p < 0.001. G, schematic illustrating possible mechanism of control of miR-155 via Ets2.

