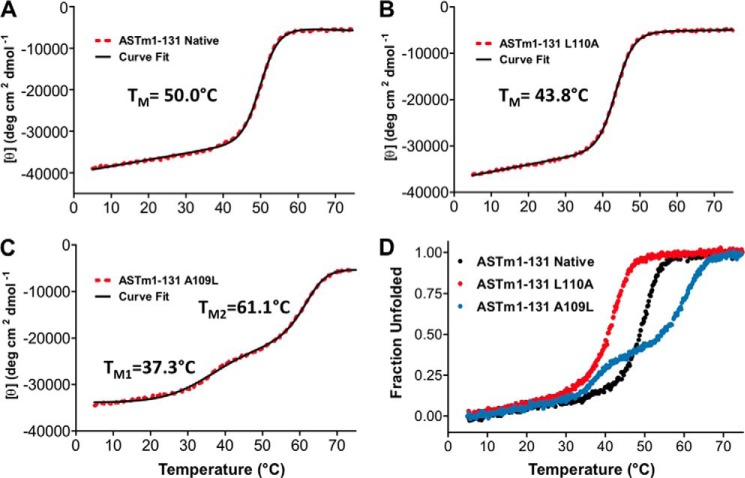
FIGURE 4.
Thermal denaturation profiles of wild type and mutant Tm(1–131) proteins using CD spectroscopy. Shown are the Tm(1–131) protein unfolding profiles (red dots) (A, wild type; B, L110A; C, A109L) with their associated nonlinear least-square fits (black lines) (89). D, the overlaid profiles for wild type (black), L110A (red), and A109L (blue) are shown in fraction folded. A and B show apparent single-transition profiles with characteristic pretransition coiled-coil baselines. C shows two distinct transitions induced by the single mutation A109L, which simultaneously increases and decreases stability in different regions of the molecule. ASTm(1–131) indicates the presence of an N-terminal Ala-Ser dipeptide in these Tm(1–131) sequences. All profiles were measured with a temperature change of 1 °C/min.

