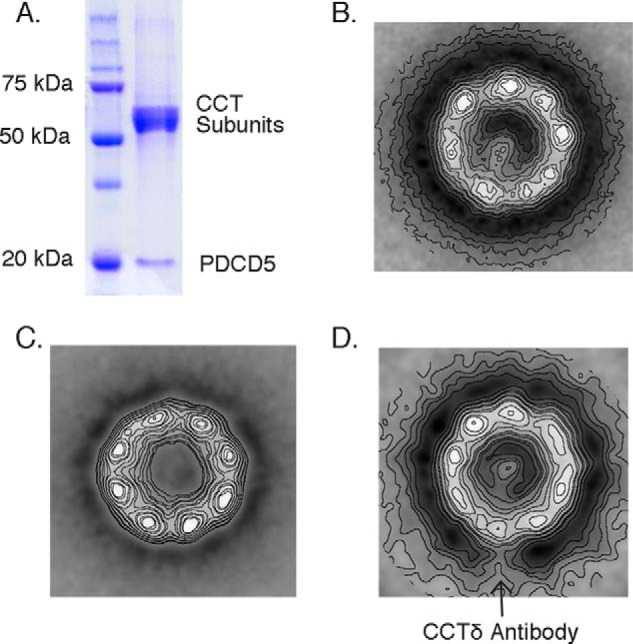
FIGURE 4.

PDCD5 binds CCT near the δ subunit. A, gel analysis of the PDCD5·CCT complex. PDCD5 was mixed with CCT at a 10:1 molar ratio in the absence of nucleotide, and the mixture was resolved on a native polyacrylamide gel. The CCT oligomer (∼960 kDa), which runs with a mobility clearly distinct from that of PDCD5 (∼14 kDa), was excised and run on a denaturing acrylamide gel revealing bands corresponding to the eight CCT subunits and a band corresponding to PDCD5. B–D, average electron microscopy images obtained from negatively stained particles. B, PDCD5-CCT; C, apo-CCT; D, anti-CCTδ-PDCD5. Images were averaged from 1356, 1128, and 1018 particles, respectively.
