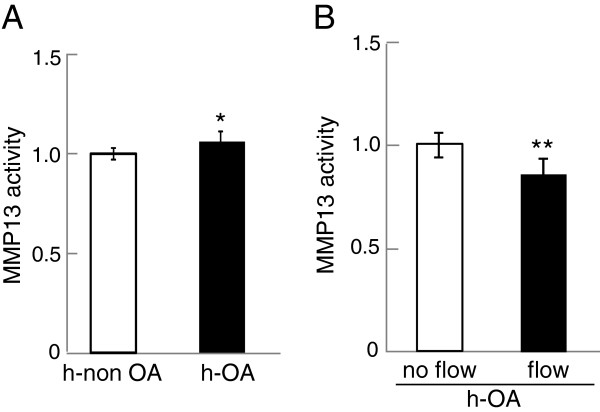
Figure 6.
MMP13 activity levels of primary chondrocyte cells isolated from normal cartilage tissue as well as OA cartilage tissues (h-OA). (A) Comparison of MMP13 activity levels of normal and h-OA primary chondrocyte cells. (B) Reduction of MMP13 activity in h-OA primary chondrocyte cells in response to 1-hr fluid flow shear at 5 dyn/cm2. n = 3 per group (A-B).

