
Figure 4.
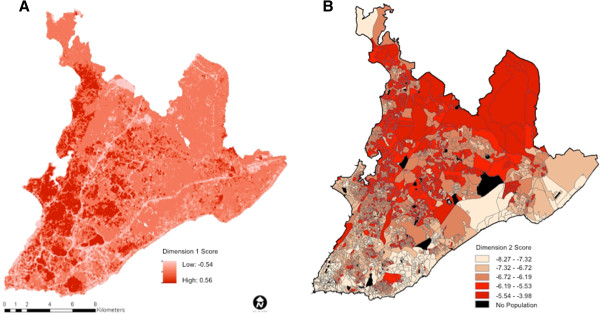
First and second dimension of the canonical correlation analysis. Visual representation of the Dimension 1 score mapped at the pixel level (A) and Dimension 2 score mapped at the census tract level (B).
Official websites use .gov
A
.gov website belongs to an official
government organization in the United States.
Secure .gov websites use HTTPS
A lock (
) or https:// means you've safely
connected to the .gov website. Share sensitive
information only on official, secure websites.
First and second dimension of the canonical correlation analysis. Visual representation of the Dimension 1 score mapped at the pixel level (A) and Dimension 2 score mapped at the census tract level (B).