
Figure 5.
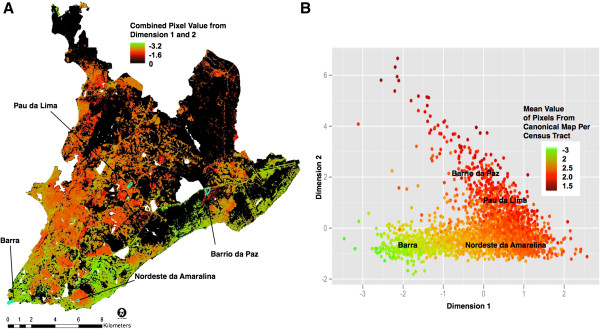
Mapping in geographic and canonical space. A) Map of deprivation in Salvador at 30 m × 30 m resolution using combined canonical dimensions 1 and 2. Green areas are at a low risk of slum characteristics, while red indicates a high risk for slum characteristics. The final map was clipped to the impervious surfaces. The geographic location of selected communities representing a range of land cover and socioeconomic characteristics is also represented. B) Location of the same communities in canonical space. Canonical scores for dimensions 1 and 2 are shown for all census tracts; the colors correspond to the mean combined dimension 1 and 2 score for each census tract (as represented in A).