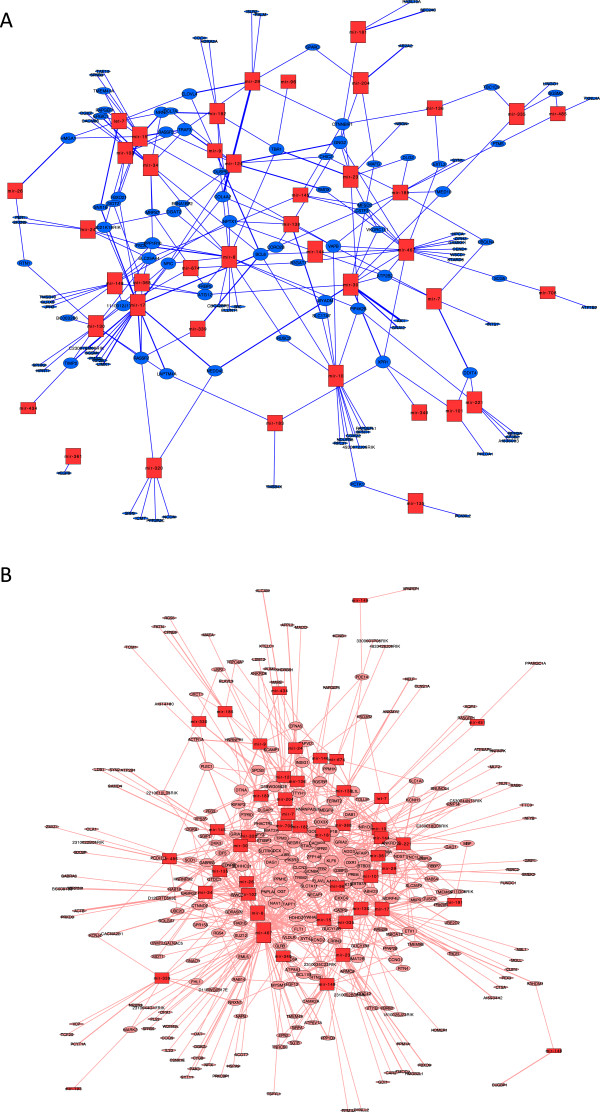
Figure 3.
Alcohol-induced miRNA-mRNA interaction networks. A: Interaction network among upregulated miRNAs (red squares) and downregulated mRNAs (blue circles); average number of neighbors 2.95. B: Interaction network among upregulated miRNAs (red squares) and upregulated mRNAs (pink circles); average number of neighbors 4.97. The average number of neighbors represents the average number of links (edges) a node has to other nodes. The size of the nodes is proportional to the number of edges (interactions, represented as lines) for each node.

