
Figure 7.
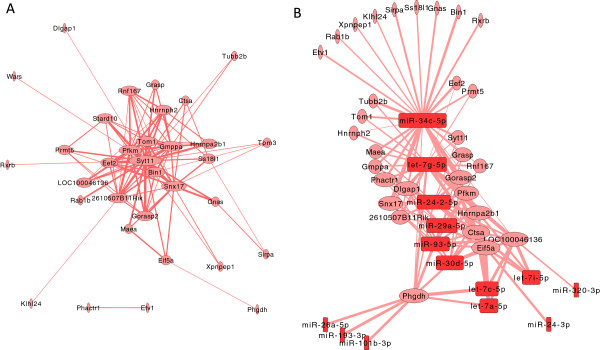
Coexpression networks for red module. A: coexpression network of gene-gene interactions among genes with high GS and high MM. Node width is proportional to node connectivity (number of edges/interacting partners), and edge size is proportional to the weight of the particular interaction; B: network of correlated miRNA-mRNA expression profiles (node width is proportional to the connectivity of the node, and edge size is proportional to the correlation between miRNA and mRNA expression). Pink ovals represent upregulated genes; red rectangles represents upregulated miRNAs.