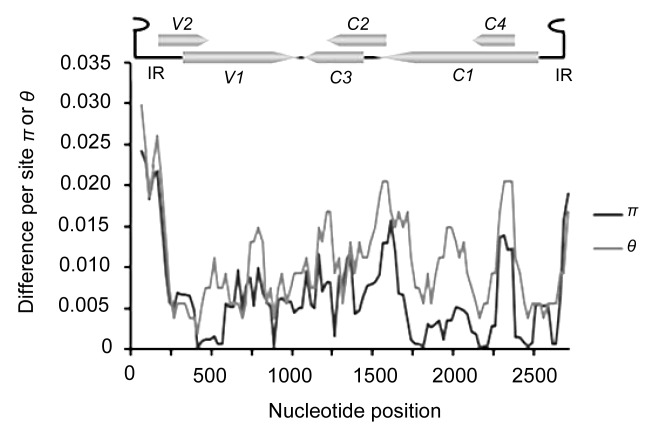
Fig. 2.
Distribution of genetic variation estimated by nucleotide diversity (π) and Watterson’s parameter (θ) for TYLCV
The sliding window size is 100 sites wide, slide by 25-site intervals. The relative positions of the six ORFs and the intergenic region of the TYLCV genome are illustrated by lines above the plot. IR: intergenic region

