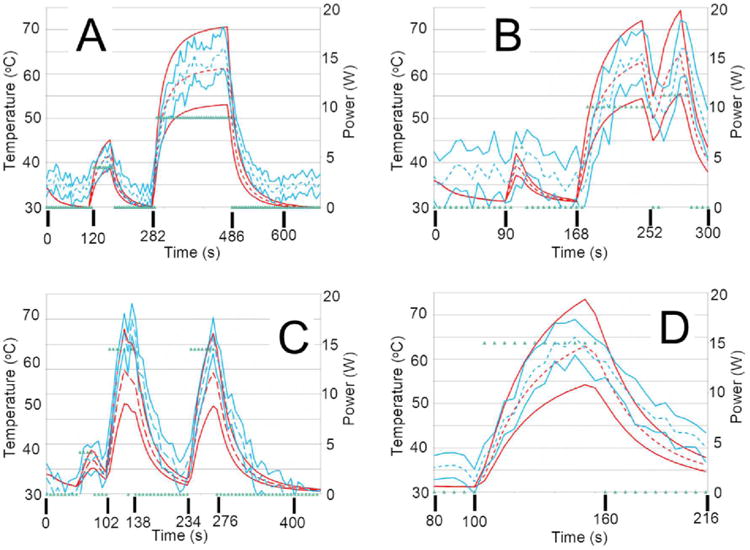
Figure 6.

These temporal profiles, A) through D), are temporal profiles from canines 1 through 4, respectively. The red and blue dashed and solid lines represent the same as in Figure 5. The green points represent the power history. The spatial locations of the temporal profiles are shown in Figure 4 via the green diamonds. A) and D) show the best agreement of the four plots. B) is more successful at the beginning of the imaging sequence but the model is much colder at later time points. C) tends to be somewhat cooler, but significant overlap remains between the MRTI and model distributions.
