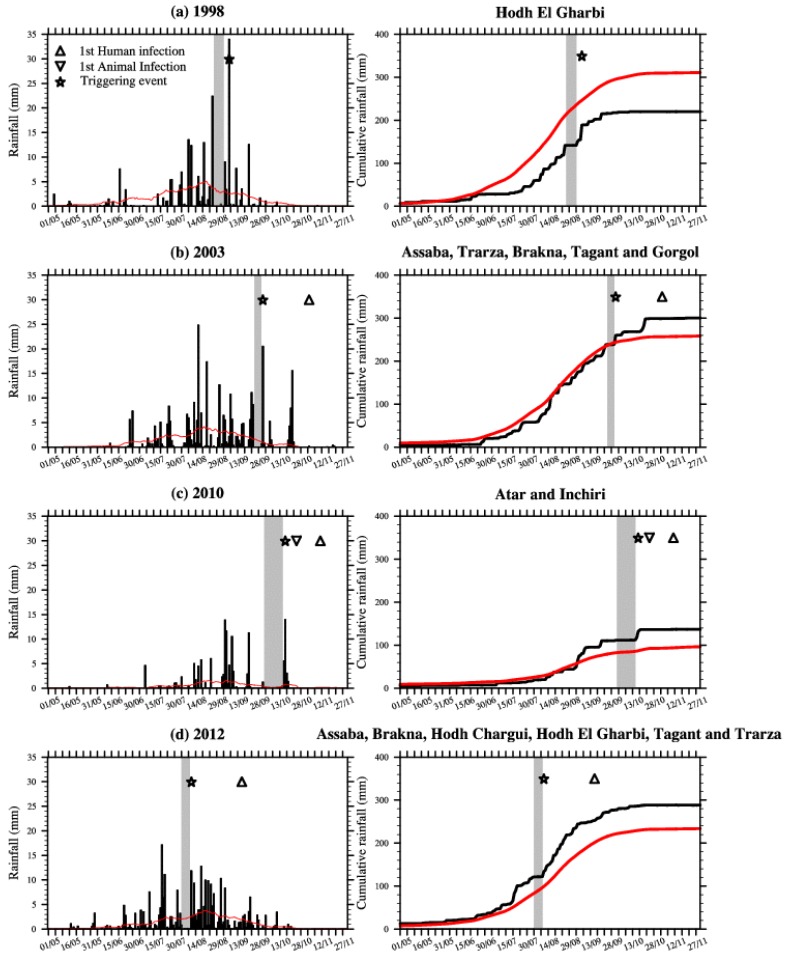
Figure 2.
Rainfall indices (mm) averaged over (a) 15.5°N–17.5°N, 11°W–8.5°W in 1998, (b) 15.5°N–19°N, 16.25°W–11°W in 2003, (c) 19°N–21°N, 14.75°W–12.75°W in 2010 and (d) 15.5°N–19.25°N, 15.85°W–6.5°W in 2012. This is based on the TRMM rainfall dataset; see Figure 1 for a definition of the domains covering the RVF outbreak locations. Right: Cumulative rainfall (mm) for the same areas. The red line depicts the rainfall climatology (1998–2012) calculated for the respective areas. Dry spells are highlighted by the gray shading, large rainfall event are shown with stars and the first human and animal RVF reported cases are depicted by triangles.

