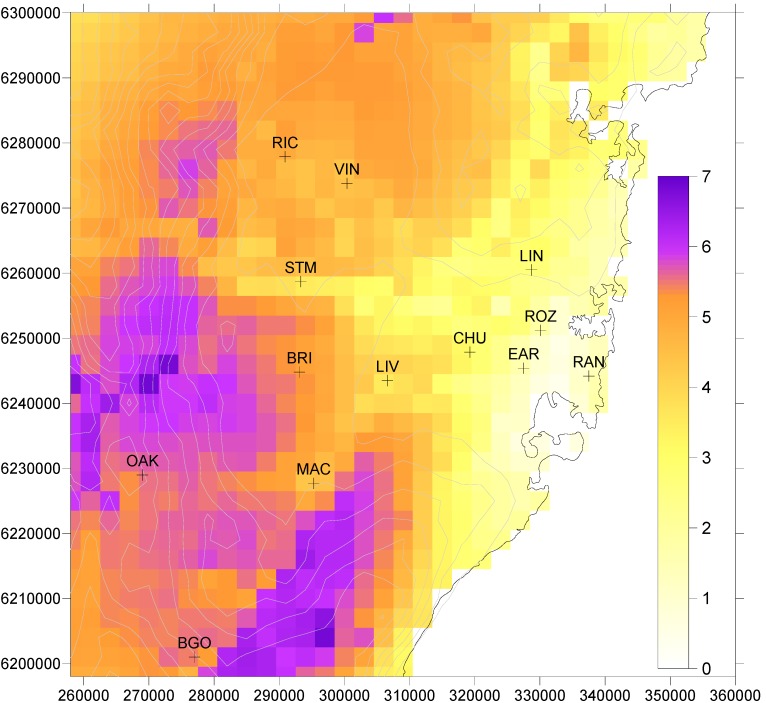
Figure 1.
Daily 1 h maximum ozone concentration (ppb) averaged over the period 1996–2005, with a threshold value of 40 ppb subtracted (negative values are set to zero). Contours indicate elevation above sea level at 50 m intervals up to 850 m. Symbols indicate locations of air quality stations in the EPA New South Wales monitoring network. Values on axes in all Figures are distance in meters.

