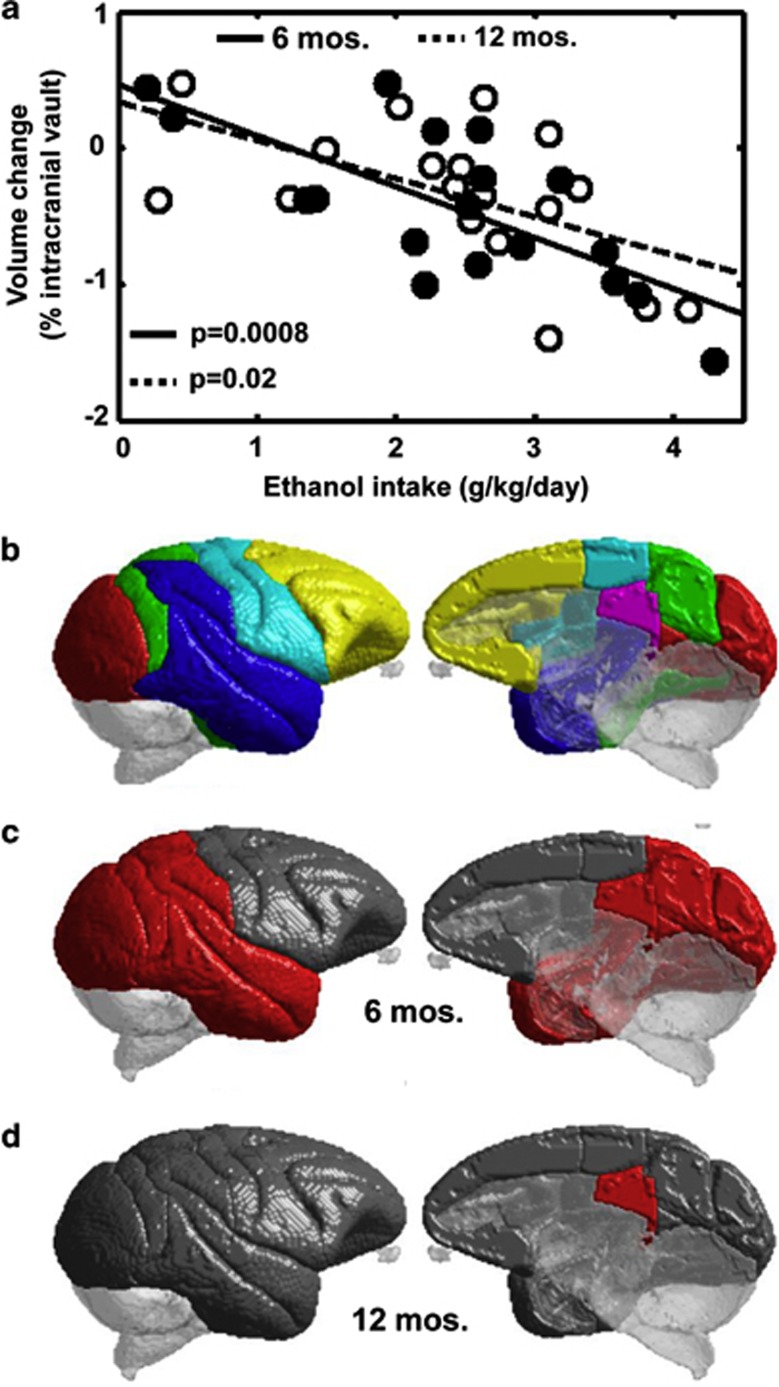
Figure 2.
Correlations between cerebral cortical volume changes and daily ethanol intake. (a) Overall cerebral cortical volume change, expressed as percentage of the intracranial volume, as a function of mean daily intake for all monkeys following 6 months of drinking (solid symbols and lines) and following 12 months of drinking (open symbols/dashed lines). Cerebral cortical subregions were differentially susceptible to ethanol-related volume changes. (b) Following the NeuroMaps annotation scheme (Rohlfing et al, 2012), the cerebral cortex was parcellated into frontal (yellow), somatosensory/motor (light blue), parietal (green), temporal (dark blue), occipital (red), and allocortical (purple) regions. (c) Statistically significant negative correlations were observed between volume decline and higher mean daily ethanol intake within parietal, temporal, occipital, and allocortical regions following 6 months of drinking, as indicated by red areas. (d) Following 12 months of drinking, a significant negative correlation is observed only between allocortical volume decline and higher mean daily ethanol intake.

