
Figure 1.
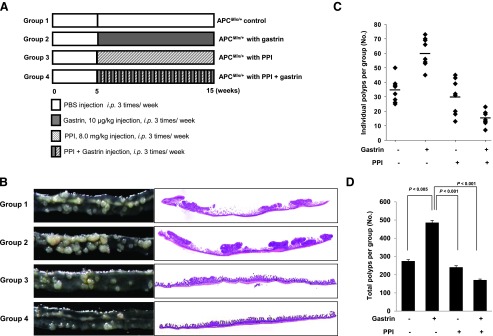
The gross morphology of intestinal polyposis according to group in an APCMin/+ mouse model. (A) The schematic overview of the experimental protocol of an animal model for small intestine polyposis using APCMin/+ mice. (B) Gross and microscopic pathologies according to group: control, gastrin, PPI alone, and the combination of PPI and gastrin. Representative gross and pathologic pictures (original magnification, x1). (C) The polyps in the small intestine of the individual mouse were counted according to group. Gastrin administration significantly increased the polyp number, but PPI treatment markedly decreased in groups 3 and 4. (D) Total polyps in the whole small intestine were counted according to group. Gastrin administration significantly increased polyp number (P < .005), but statistically significant decreases in polyp numbers were observed in groups 3 and 4 compared with group 2 (P < .001). Results are expressed as means ± SD (n = 8).