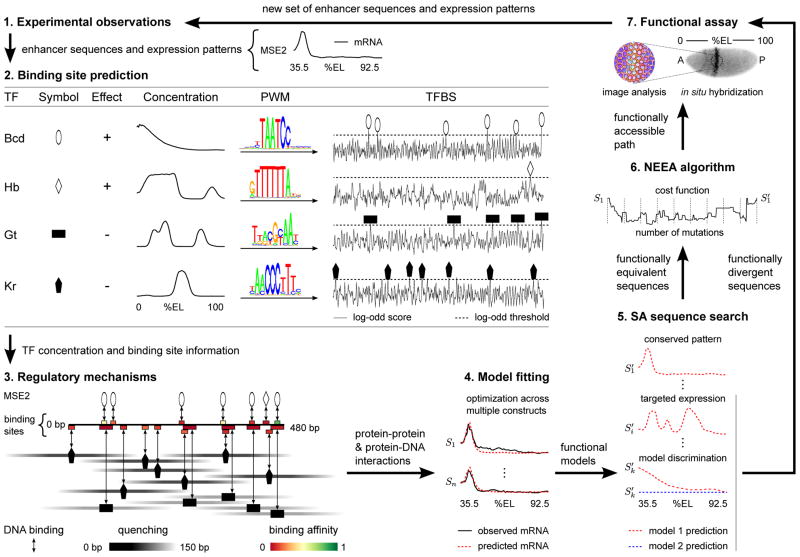
Figure 1. Iteration cycle for the systematic improvement of a transcriptional model.
The NEEA algorithm and the SA sequence search methodology can be used to increase both the scope and precision of a transcriptional model. The numbers label the separate steps in the cycle and the arrows describe the flow of information between the steps. 1) The cycle starts with a set of known enhancer sequences and their corresponding quantitative expression patterns. 2) Each sequence is scored for the presence of binding sites using PWMs. Open and blacked-filled shapes represent activators (+ effect) and repressors (− effect) respectively. As an illustration, binding site prediction of the 4 main regulators of MSE2 are shown. 3) The known regulatory mechanisms by which TFs influence transcription, along with the predicted TFBSs, binding affinity, and TF concentrations are used to determine the set of all protein-protein and protein-DNA interactions. The diagram shows both competitive binding and quenching interactions for MSE2. Binding sites are colored coded for relative binding affinity. Activators and repressor are shown over and below the line respectively. The quenching efficiency is shown along the horizontal axis by a symmetrical gradient centered on each repressor. Quenching of activator binding sites within the range of a repressor will result in decreased occupancy of the site. 4) The parameters describing the intensity, range, and effect of all interactions are fitted by minimizing the sum of the squared differences between the observed and predicted expression across all constructs and data points. The optimization procedure can produce multiple functional models. 5) SA is used in conjunction with a functional model to search the sequence space for novel enhancers predicted to express in the same pattern to that of an enhancer in the previous iteration. SA can also be used to find enhancers predicted to express in a target expression pattern or that allow discrimination between alternative models. 6) NEEA can be used to find a functionally accessible path between an enhancer in a previous iteration and a novel, functionally equivalent sequence. Sequences sampled at intervals along the path are then synthesized for empirical analysis. 7) Synthesized sequences predicted to express in either conserved or divergent patterns are cloned into an expression vector and their activity assayed in vivo. Shown is a fluorescent in situ hybridization of a Drosophila embryo expressing lacZ driven by the MSE2 enhancer. Confocal images of multiple embryos are analyzed in order to derive the quantitative expression pattern. The new set of enhancers and their corresponding functional output are then added to the previous set for the next round of the iteration.

