
Figure 2. Increasing the average move size results in a decrease in the acceptance ratio of proposed moves.
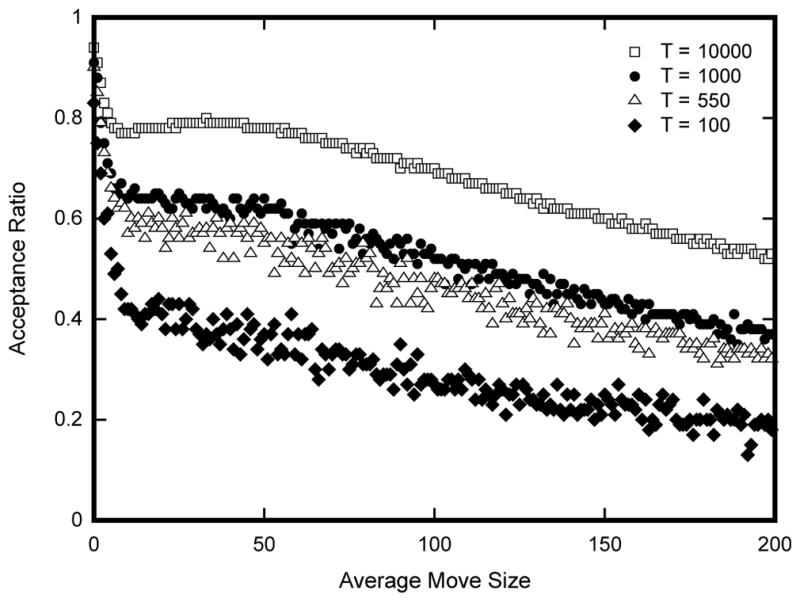
Each point in the graph corresponds to the average acceptance ratio of 105 proposed moves. Acceptance ratio was calculated as the number of accepted moves over the total number of proposed moves from a fixed point in the annealing run. Average move size corresponds to the average number of substitutions per annealing step. Data were collected at four different temperatures during the annealing process (104, 103, 550, and 100). Simulated annealing was carried out with an initial temperature of 106 and allowed to cool according to the Lam adaptive schedule. Once the annealer reached the specified equilibrating temperature, the temperature was kept constant and statistics on acceptance ratios were recorded. Average move size at each equilibrating temperature was increased from zero to two hundred in increments of one.