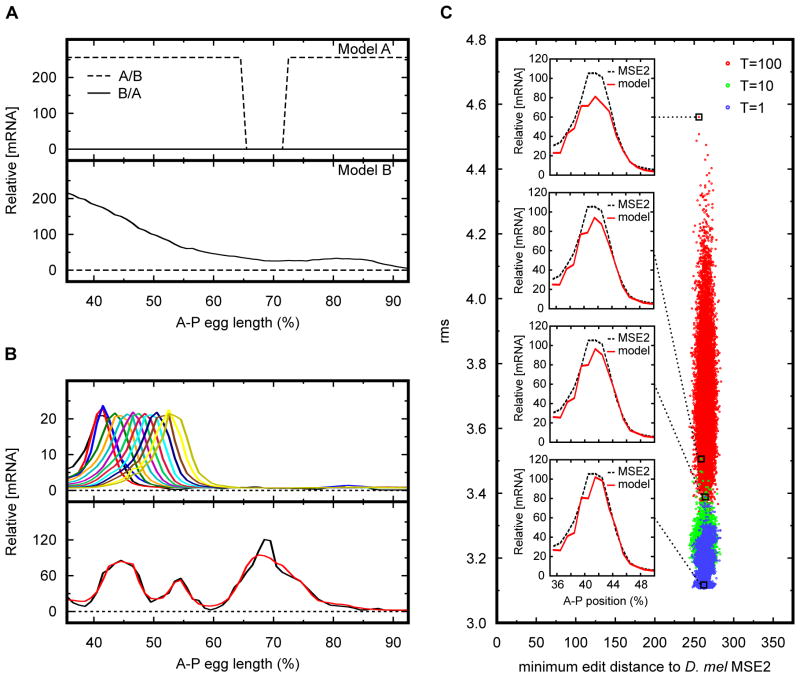
Figure 4. Applications of simulated annealing on sequence.
(A) Method for distinguishing between two alternative models of transcriptional regulation. Simulated annealing was used to find a DNA sequence that maximizes the differences between model predictions. Dashed line corresponds to sequence A/B that is predicted to express strongly throughout most of the embryo by model A, but would have no expression under model B. Solid line represents sequence B/A predicted to express in an anterior-posterior gradient under model B, but is predicted not to express under model A. Top and bottom panels show predictions by model A and B respectively. (B) Method for generating arbitrary expression patterns. Simulated annealing was used to design enhancers predicted to express in target expression patterns. Top panel shows a collection of predicted 480 bp synthetic enhancers that would drive expression in a stripe pattern at different A–P positions along the embryo. Bottom panel shows a 4 kb synthetic enhancer predicted to express in an arbitrary target pattern. Model prediction is in red while target expression pattern is in black. Horizontal axis for panels A and B show A–P embryo position in percent egg length length. Vertical axis for panels A and B shows relative mRNA concentration. Dashed line in panel B depicts the no-expression reference point for mRNA expression. (C) Method for creating an ensemble of functionally equivalent enhancers. Simulated annealing was used to generate a collection of 105 480 bp enhancer sequences predicted to express in a D. mel eve stripe 2 expression pattern. Each dot represents a synthetic enhancer sequence. Sequences were generated by sampling the annealing process every 105 moves at three different equilibrating temperatures. Red, blue, and green dots represent sequences sampled at annealing temperatures of 100, 10, and 1 respectively. Horizontal axis shows the minimum edit distance between the synthetic sequence and the D. mel MSE2. Vertical axis shows the calculated root mean squared difference between the model prediction and the observed D. mel MSE2 pattern used as reference. Figure inserts show predicted expression patterns of representative sequences sampled at different temperatures. Red line corresponds to model prediction while dashed line corresponds to the reference MSE2 expression pattern.

