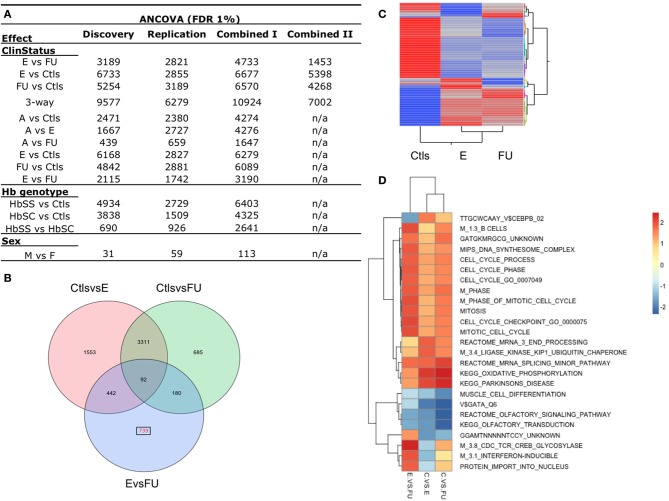
Figure 2.
Differential gene expression between SCD disease status. (A) Number of differentially expressed probes for the following effects: SCD clinical status (E, Entry; FU, Follow-up; Ctls, Controls; A, Acute), Hb genotypes (HbSS, HbSC, Ctls), and between sexes (M, males; F, females). The 3way-ClinStatus effect is between E vs. FU vs. Ctls. These results were obtained from an analysis of covariance (ANCOVA, FDR 1%) of the discovery, replication and combined datasets I and II and accounts for sex and total blood cell counts (RBC and WBC). (B) Venn diagram of the 7002 differentially expressed probes for the 3-way clinical status effect in the combined data set II. In red, 735 probes are shown to be differentially expressed uniquely between E vs. FU SCD patients. (C) Two-way hierarchical clustering of the mean expression levels for the 7002 differentially expressed probes in the combined data set II for each group of patients (E, FU, Ctls) is shown. Mean expression from this class of genes cluster controls from SCD entry and follow-up patients. (D) Gene Set Enrichment Analysis (GSEA) was performed for each contrast of the clinical status effect using the combined dataset II. This analysis identified biological pathways and sets of individual genes that are significantly enriched in each contrast. Selection of the most distinctive significantly enriched pathways between entry and follow-up groups is shown. Cells are colored by their respective Normalized Enrichment Scores for a given contrast. See also Figure S6.

