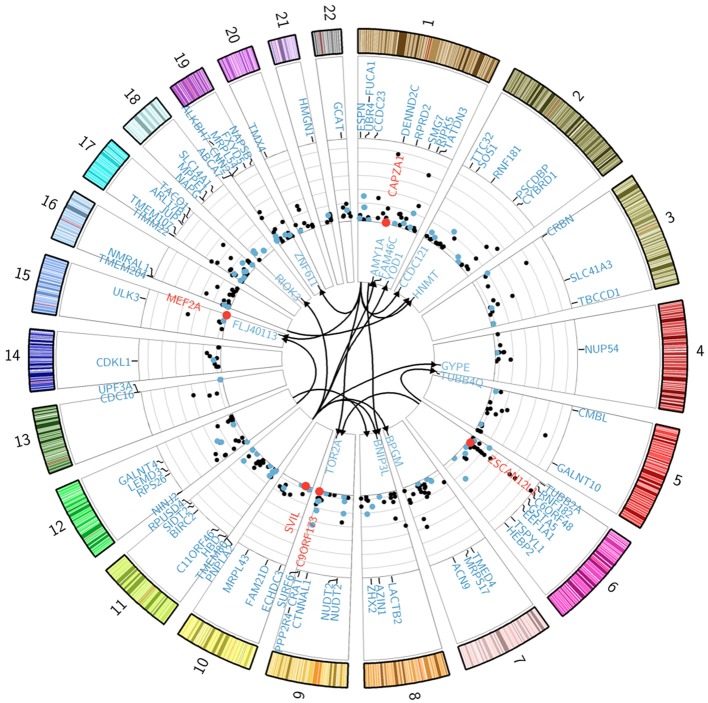
Figure 3.
Genetic regulation of gene expression in SCD patients. The Circularized Manhattan plot shows genome-wide significant SNP-probe associations for the analysis that used the combined II dataset. Bonferroni correction for multiple testing was applied to all of our analyses with a genome-wide significance threshold of p < 0.05/(19,431 probes × 200 SNPs) = 1.28 × 10−08 (NLP = 7.89) for local associations in model 1 and p < 0.05/(19,431 probes × 560,675 SNP) = 4.59 × 10⁻¹² (NLP = 11.34) for distal-associations in model 1; while model 2 thresholds were p < 0.05/(7002 probes × 200 SNPs) = 3.57 × 10−08 (NLP = 7.45) for local associations and p < 0.05/(7002 probes × 455,750 SNP) = 1.57 × 10⁻¹¹ (NLP = 10.80) for distal-associations. Distal associations are shown in the center of the plot. All genes involved in an interaction effect are differentially expressed and shown in red. eSNP genes from model 1 that are differentially expressed for the clinical status effect are shown in blue. The y-axis of the Manhattan plot indicates significance values (−log10 p-values) for the local-associations. Genes under eSNP control that are not differentially expressed for the clinical status effect (in the ANCOVA analysis at FDR 1%) are shown in black. See also Table S1.

