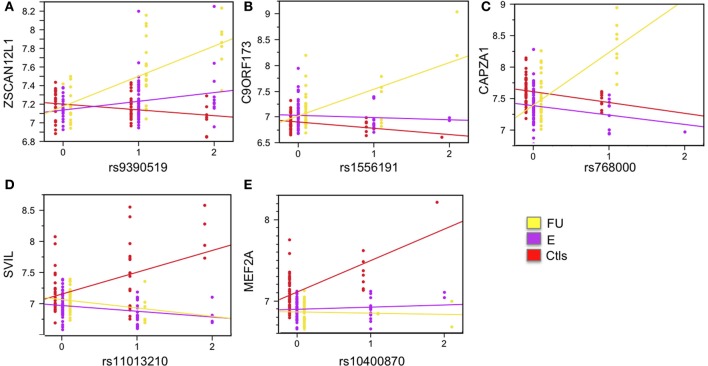
Figure 4.
Examples of significant SNP-by-clinical status interaction effects. Five SNP-by-clinical status interaction effects are shown. All are local eSNP interactions. Expression levels are shown on the y-axis, and SNP genotype on the x-axis. The eSNP interaction involving gene zinc finger and SCAN domain containing 12 pseudogene 1 (ZSCAN12L1) is shown in (A); chromosome 9 open reading frame 173 (C9ORF173) is shown in (B); capping protein (actin filament) muscle Z-line, alpha 1 (CAPZA1) is shown in (C); supervillin (SVIL) is shown in (D); and myocyte enhancer factor 2A (MEF2A) is shown in (E). Linear regression for each group is plotted and colored: yellow for follow-up, FU; purple for entry, E; and red for controls, Ctls. See also Figure S7.

