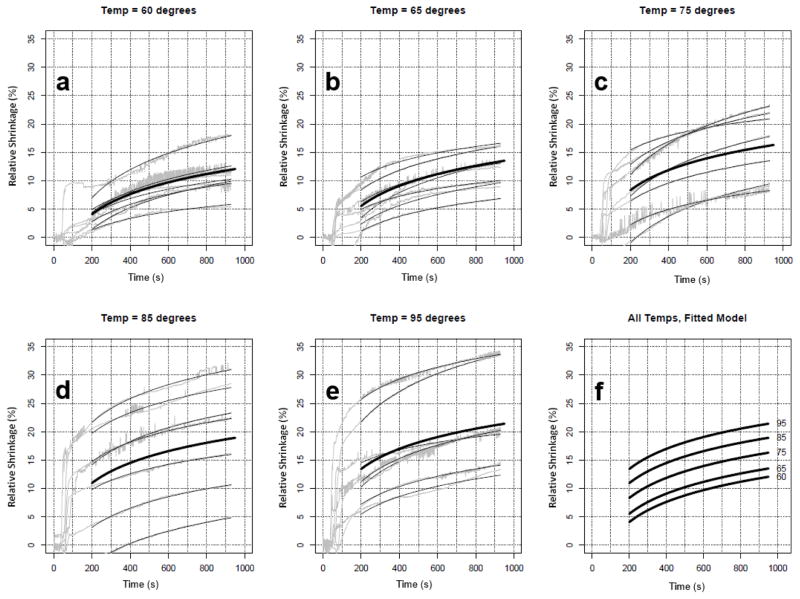
Figure 6.
Experimental shrinkage curves of porcine liver (gray) and fitted regression models (thin black lines) per experiment (a–e). The thick black line shows the ‘fitted’ model per temperature. (f) shows a plot of the fitted model for all 5 temperatures, demonstrating a clear increase in shrinkage by temperature.

