
Fig. 5.
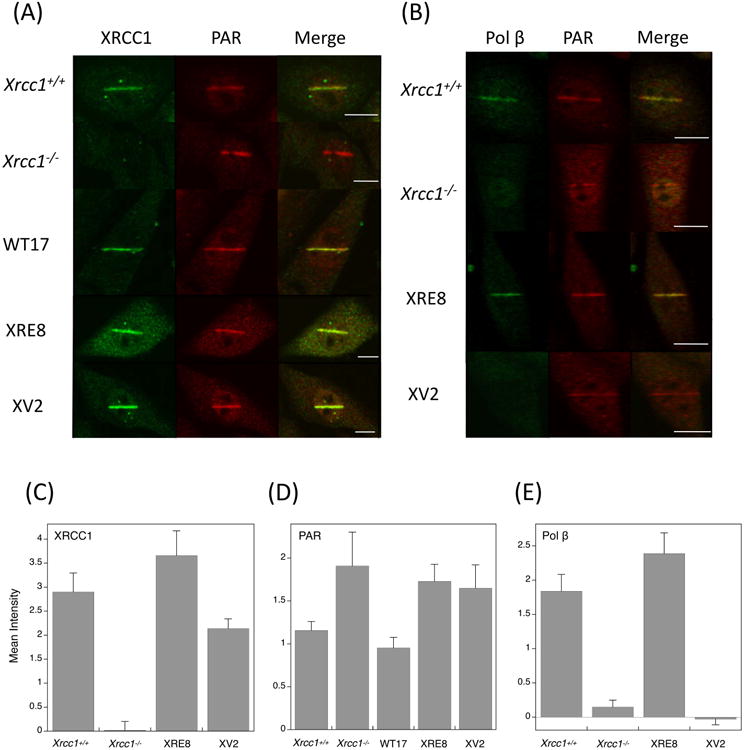
Immunofluorescence imaging of (A) XRCC1 and PAR and (B) pol β and PAR in XRCC1 cell variants. Experiments are as described in Section 2 and typical results are shown. Cell lines were irradiated in stripes, then allowed to repair for 1 min before assessment of XRCC1 and pol β recruitment, and PAR synthesis as indicated. Bars represent 10 μm. (D-F) Quantification of recruitment and synthesis data at 1 min after laser damage. Between 10 and 20 cells were analyzed in each case, error bars represent SEM.