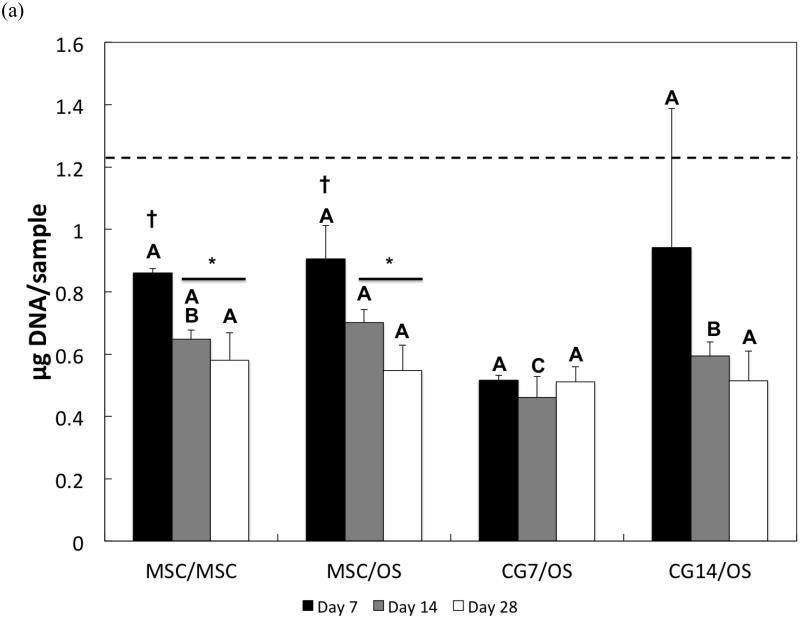
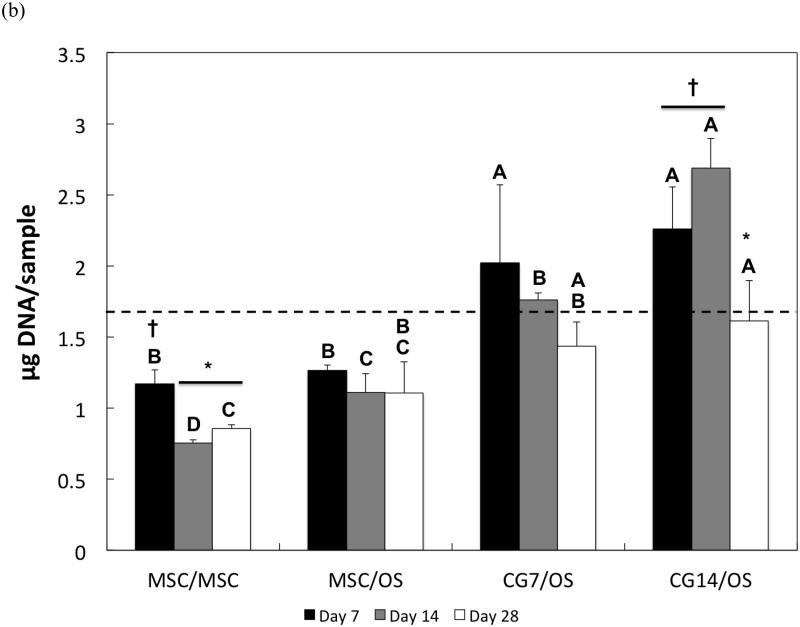
Figure 4.
DNA content of cells in the (a) chondral layer and the (b) subchondral layer of bilayered hydrogel constructs at various time points. The dashed line indicates the average starting levels of DNA measured at Day 0 immediately after encapsulation. At each individual time point, groups not connected by the same letter are significantly different (p<0.05); comparing time points within each group, groups not connected by the same symbol are significantly different (p<0.05). Error bars represent the standard deviation for n = 4 samples.


