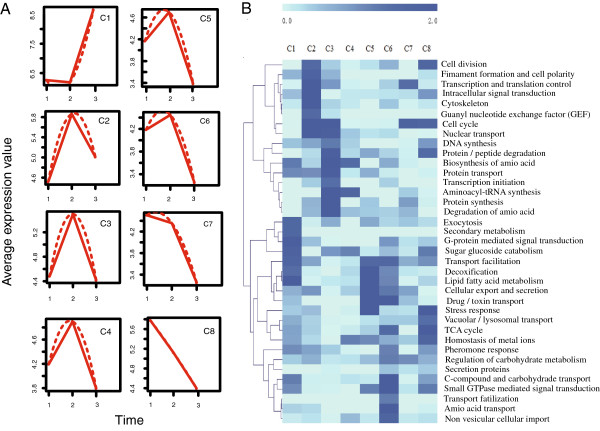
Figure 6.
Expression profiling of trap-formation and pathogen associated genes in D. stenobrocha. A) Genes are profiled into 8 clusters as the expressing pattern, the three time points indicate the three samples for RNA-sequence; 1) Hyphae without nematode challenge; 2) Hyphae with 22-hour nematode challenge; 3) Hyphae with 28-hour nematode challenge. B) Heat-map of expressing genes shows the expressing pattern of different gene clusters, the annotation of these genes is based on FunCat database.

