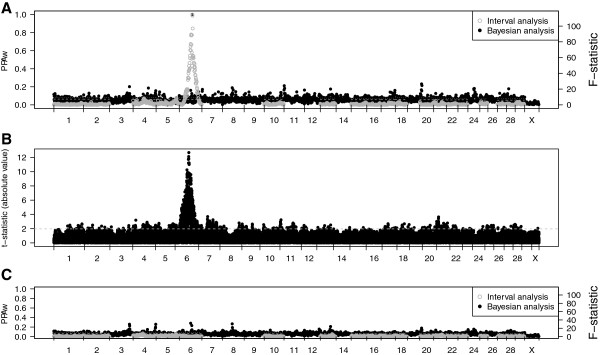
Figure 2.

Combined plots of QTL analyses using Btau4.0 build with interval and Bayesian methods. (A) Original model with chromosome-wide significant thresholds (P = 0.01 and 0.05) as the dashed and dotted lines, respectively, for the interval analysis, while the posterior probability of association (PPAw) is plotted for the Bayesian analysis; (B) original model using single-marker association methods with absolute value of t-statistics and P = 0.05 threshold as the dashed line; (C) model including KIT region breed-of-origin genotypes with chromosome-wide significant thresholds as described before.
